Fig. 3
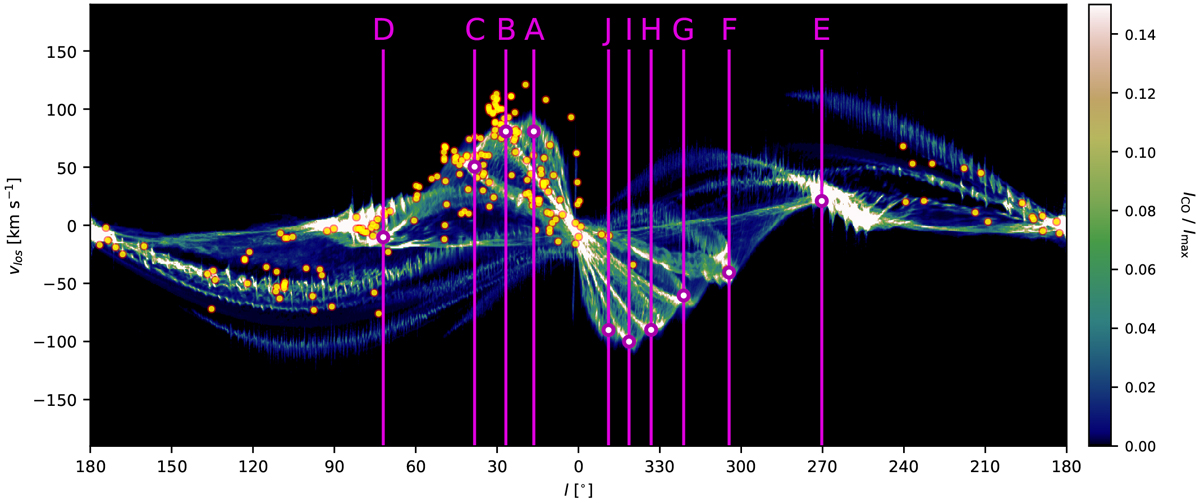
Synthetic longitude-velocity diagram of the 12CO(1–0) emission line constructed using our Galactic model by placing the observer at position P1 (see Fig. 2). The velocities are averaged within a latitude of |b| < 1.2°. Purple dots and vertical lines show detections of spiral arm tangent points, as determined from CO. Yellow dots represent observations of maser emissions coming from high-mass star-forming regions within our own Milky Way presented in Reid et al. (2019). In general, the detections depend on the tracers used (see Table 1). The detections are labeled A - J with increasing Galactic longitude. The magnitude of the CO intensity is normalized by its peak value.
Current usage metrics show cumulative count of Article Views (full-text article views including HTML views, PDF and ePub downloads, according to the available data) and Abstracts Views on Vision4Press platform.
Data correspond to usage on the plateform after 2015. The current usage metrics is available 48-96 hours after online publication and is updated daily on week days.
Initial download of the metrics may take a while.