Fig. 2
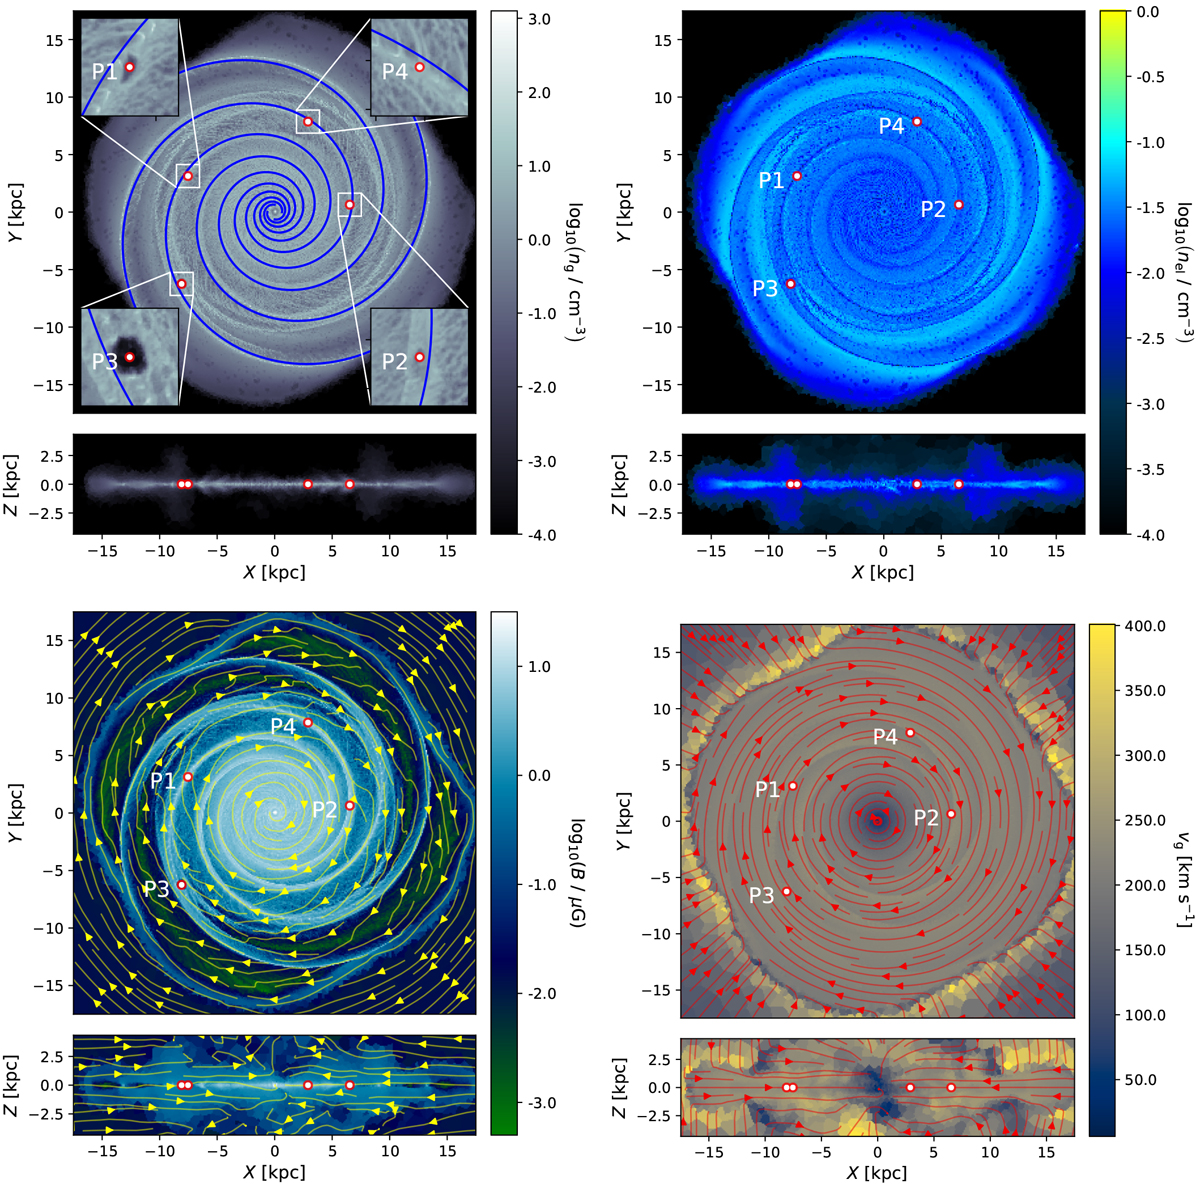
Slices though the Milky Way model described in Sect. 2.2. Clockwise from top left to bottom right: gas density ng, electron density nel, velocity vg, and magnetic field strength B. The red circles and white labels indicate the observer positions considered in the paper. The insets in the ng map (top left) show the local environment for each of the observers P1, P2, P3, and P4, and the blue spirals indicate the potential of our model. The yellow and red vector fields show the orientation of the magnetic field (bottom left) and the velocity field (bottom right).
Current usage metrics show cumulative count of Article Views (full-text article views including HTML views, PDF and ePub downloads, according to the available data) and Abstracts Views on Vision4Press platform.
Data correspond to usage on the plateform after 2015. The current usage metrics is available 48-96 hours after online publication and is updated daily on week days.
Initial download of the metrics may take a while.