Fig. 10
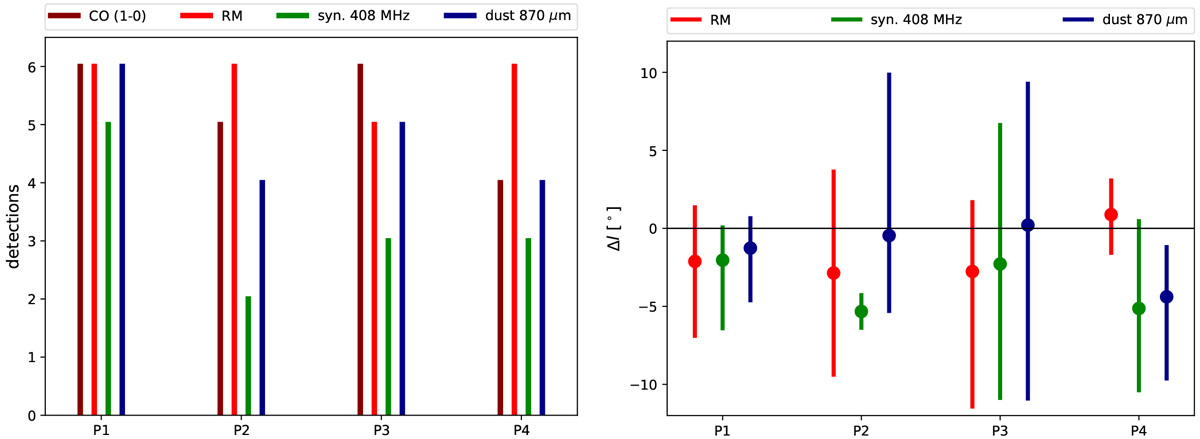
Left: number of spiral arm detections per tracer for the different observer positions P1, P3, P3, and P4, respectively. Here, only the tangent points C–H are considered leading to a maximum of six possible detections. Right: deviation of tangent point angles with respect to the angle of CO of all spiral arms. Vertical lines represent the minimal and maximal deviation for each of the four observer positions P1-P4. The colors correspond to the tracers considered in this paper and the dots are the average value.
Current usage metrics show cumulative count of Article Views (full-text article views including HTML views, PDF and ePub downloads, according to the available data) and Abstracts Views on Vision4Press platform.
Data correspond to usage on the plateform after 2015. The current usage metrics is available 48-96 hours after online publication and is updated daily on week days.
Initial download of the metrics may take a while.