Fig. 8.
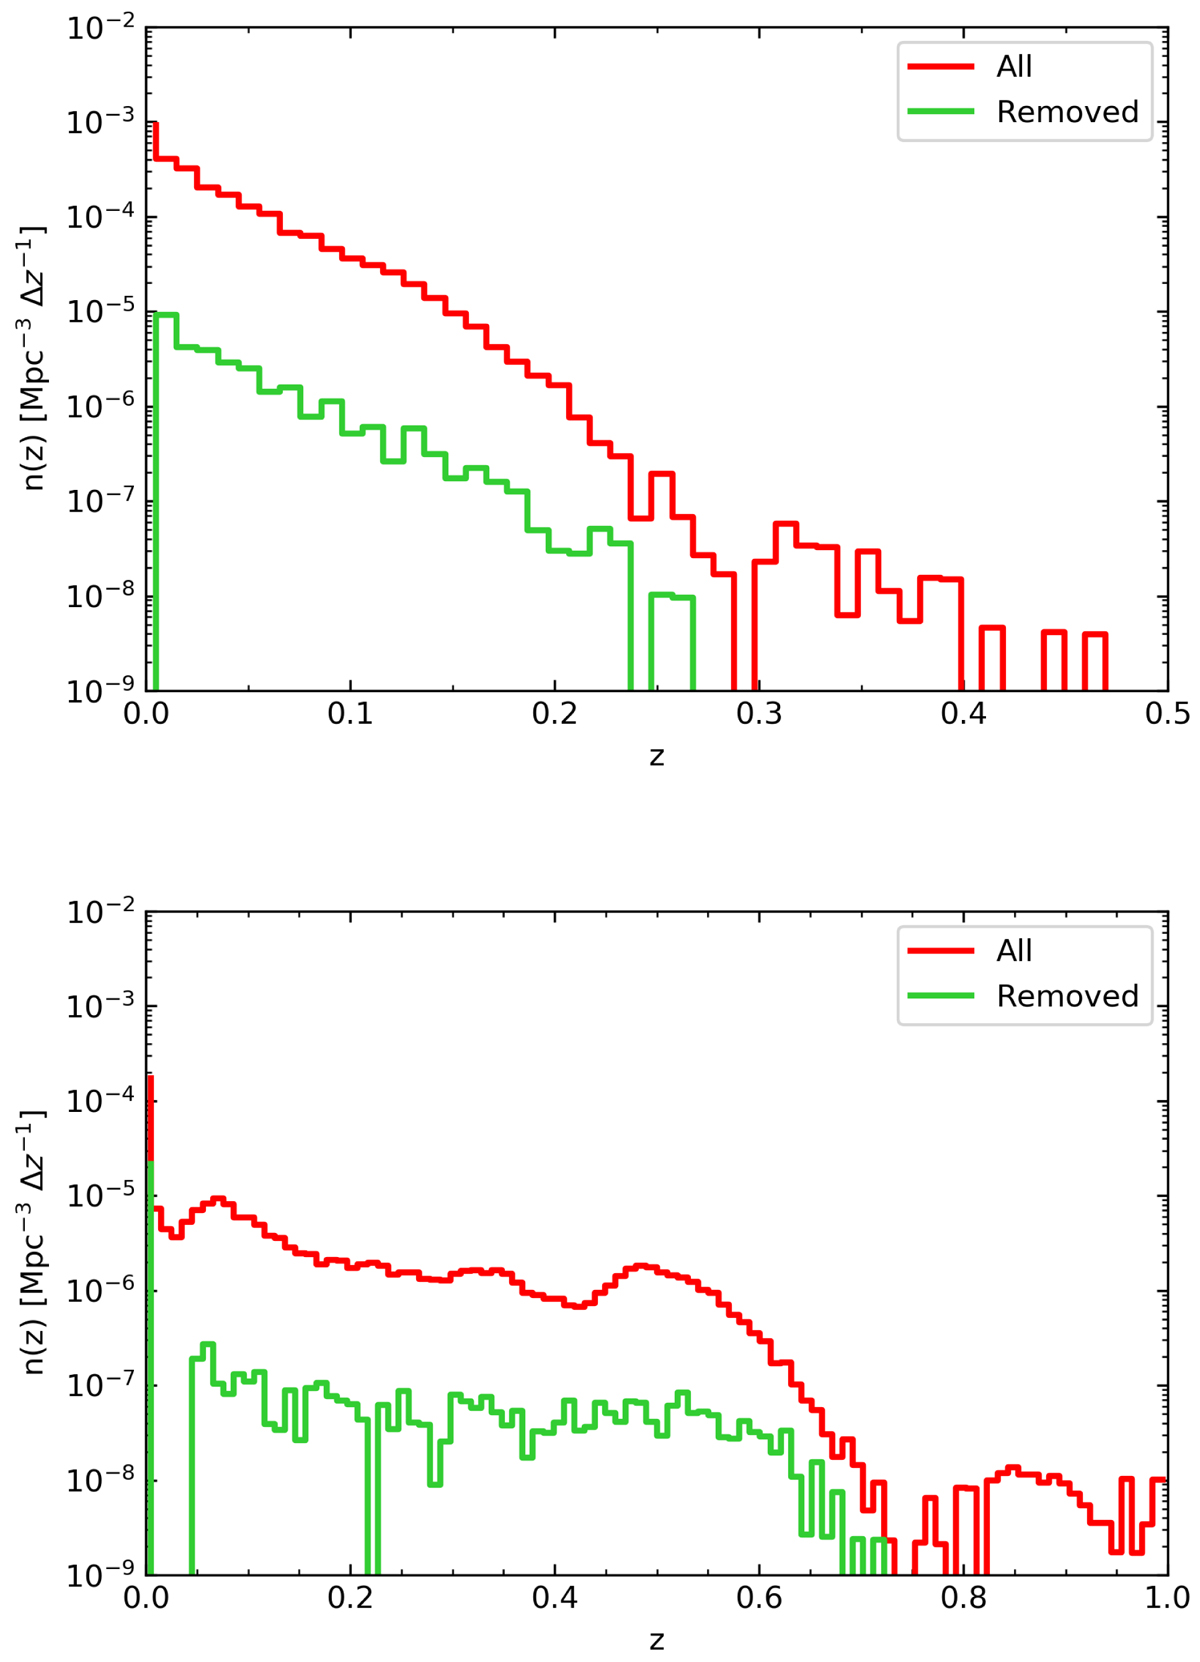
Number density distribution as a function of redshift of all critical points and of those affected by minor problems. The top panel refers to the Legacy MGS and the bottom panel to LOWZ+CMASS. In each panel the number density distribution as a function of redshift of the critical points that are affected by minor problems (see text) is marked in green. The number density distribution as a function of redshift of all critical points in the sample, regardless of their type, is marked in red. As an example, the 3σ persistence skeletons with one smoothing cycle of the density field have been chosen.
Current usage metrics show cumulative count of Article Views (full-text article views including HTML views, PDF and ePub downloads, according to the available data) and Abstracts Views on Vision4Press platform.
Data correspond to usage on the plateform after 2015. The current usage metrics is available 48-96 hours after online publication and is updated daily on week days.
Initial download of the metrics may take a while.