Fig. 23.
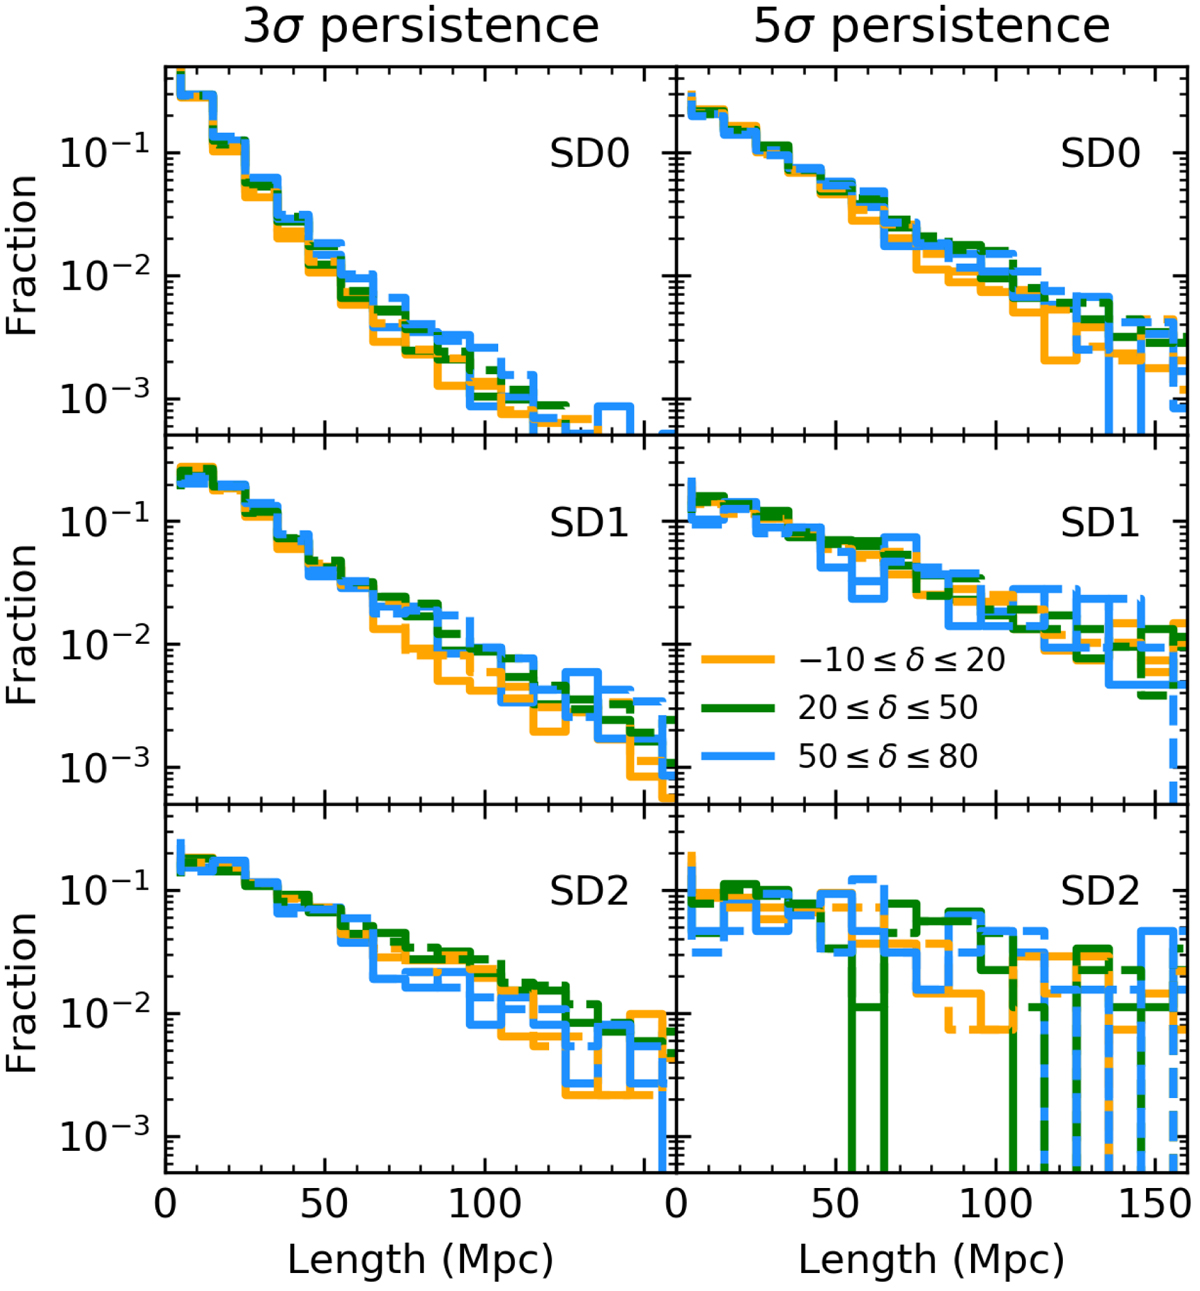
Length distribution of the filaments in three declination slices. The left and right columns refer to the two persistence thresholds we used to derive the skeleton for the Legacy MGS, i.e. 3σ and 5σ. The rows show different smoothing cycles of the density field prior to filament detection. The three declination slices are −10 ≤ δ ≤ 20deg (yellow), 20 ≤ δ ≤ 50deg (green), and 50 ≤ δ ≤ 80deg (cyan). Dashed lines and solid lines represent filament samples when no smoothing of the skeleton is applied after filament identification and when one cycle of smoothing is applied, respectively.
Current usage metrics show cumulative count of Article Views (full-text article views including HTML views, PDF and ePub downloads, according to the available data) and Abstracts Views on Vision4Press platform.
Data correspond to usage on the plateform after 2015. The current usage metrics is available 48-96 hours after online publication and is updated daily on week days.
Initial download of the metrics may take a while.