Fig. 22.
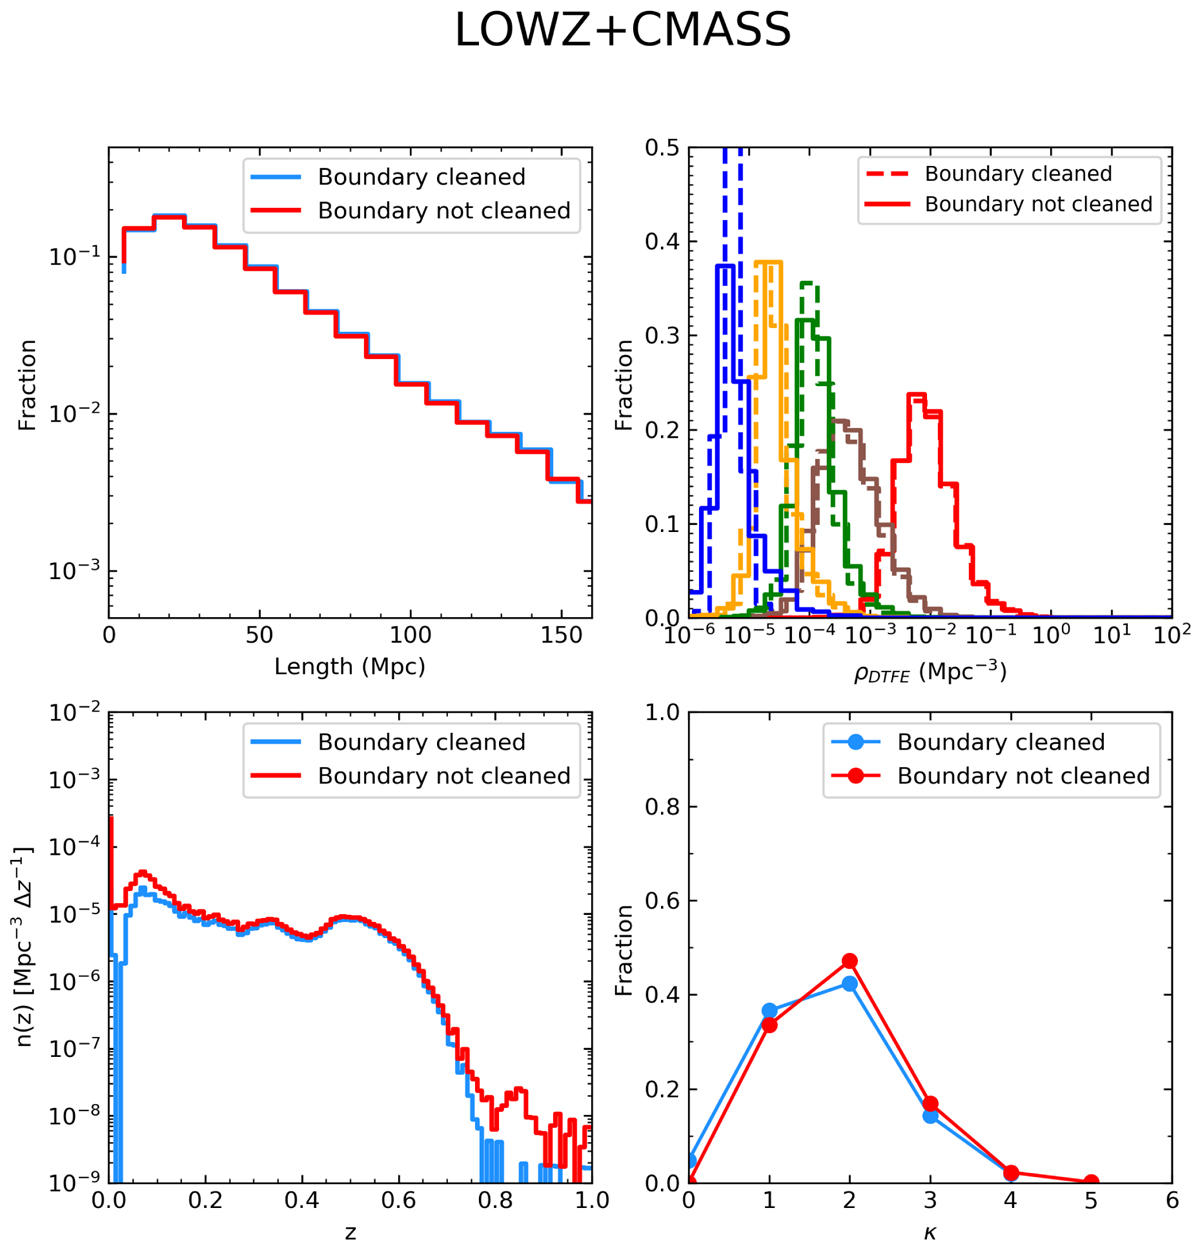
Distributions of skeleton quantities when boundary effects are taken into account. The four panels show the distributions of the filament lengths (top left), of the density of critical points divided by type (top right), of the number density of critical points as a function of redshift (bottom left), and of the connectivity of the maxima (bottom right). In the top right panel, distributions are colour-coded according to the critical point type they refer to (blue: minima, yellow: type 1 saddles, green: type 2 saddles, red: maxima, brown: bifurcations). The dashed lines refer to the distributions obtained for the case where the critical points at the boundary and the filaments connected to them have been removed, and solid lines show when they have been included. In all the other panels, the cyan line refers to the case where the critical points at the boundary and the filaments connected to them have been removed, and the red line shows the case where they have been included. This figure is for the LOWZ+CMASS case.
Current usage metrics show cumulative count of Article Views (full-text article views including HTML views, PDF and ePub downloads, according to the available data) and Abstracts Views on Vision4Press platform.
Data correspond to usage on the plateform after 2015. The current usage metrics is available 48-96 hours after online publication and is updated daily on week days.
Initial download of the metrics may take a while.