Fig. 20.
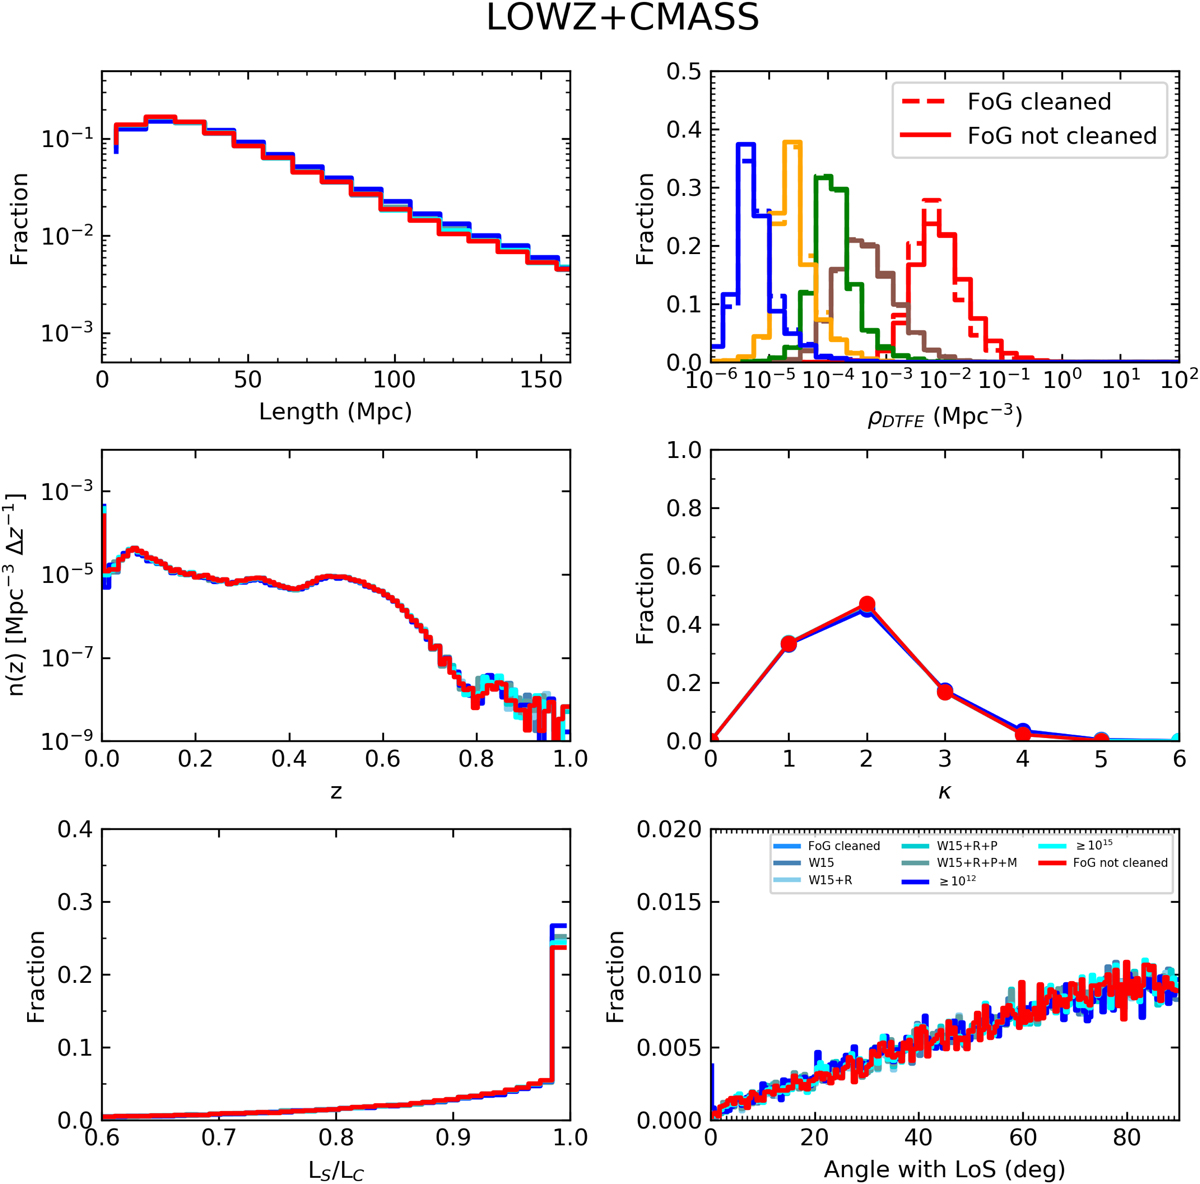
Statistical effects of the FoG effect on the skeleton. The six panels show the distributions of the filament lengths (top left), of the density of critical points divided by type (top right), of the number density of the critical points as a function of redshift of the critical points (middle left), of the connectivity of the maxima (middle right), of the curvature of the filaments (bottom left), and of the angle with the LoS of the straight filaments (bottom right). In the top right panel, distributions are colour-coded according to the critical point type they refer to (blue: minima, yellow: type 1 saddles, green: type 2 saddles, red: maxima, brown: bifurcations). The dashed lines refer to the distributions obtained for the case where the skeleton has been derived without the FoG effect and solid lines refer to the case where the FoG effect is included. In all the other panels, the red line refers to the case where the FoG is included in the derivation of the skeleton, and the different shades of cyan show the case where the FoG effect is removed using different samples of clusters or clusters of different mass, as explained in the text. In the legend, “M” refers to MCXC X-ray clusters, “P” to Planck SZ clusters, “W15” and “R” to Wen & Han (2015) and RedMaPPer optical clusters, respectively, and “FoG cleaned” to the case where all the clusters are used. This figure is for the LOWZ+CMASS case.
Current usage metrics show cumulative count of Article Views (full-text article views including HTML views, PDF and ePub downloads, according to the available data) and Abstracts Views on Vision4Press platform.
Data correspond to usage on the plateform after 2015. The current usage metrics is available 48-96 hours after online publication and is updated daily on week days.
Initial download of the metrics may take a while.