Fig. 18.
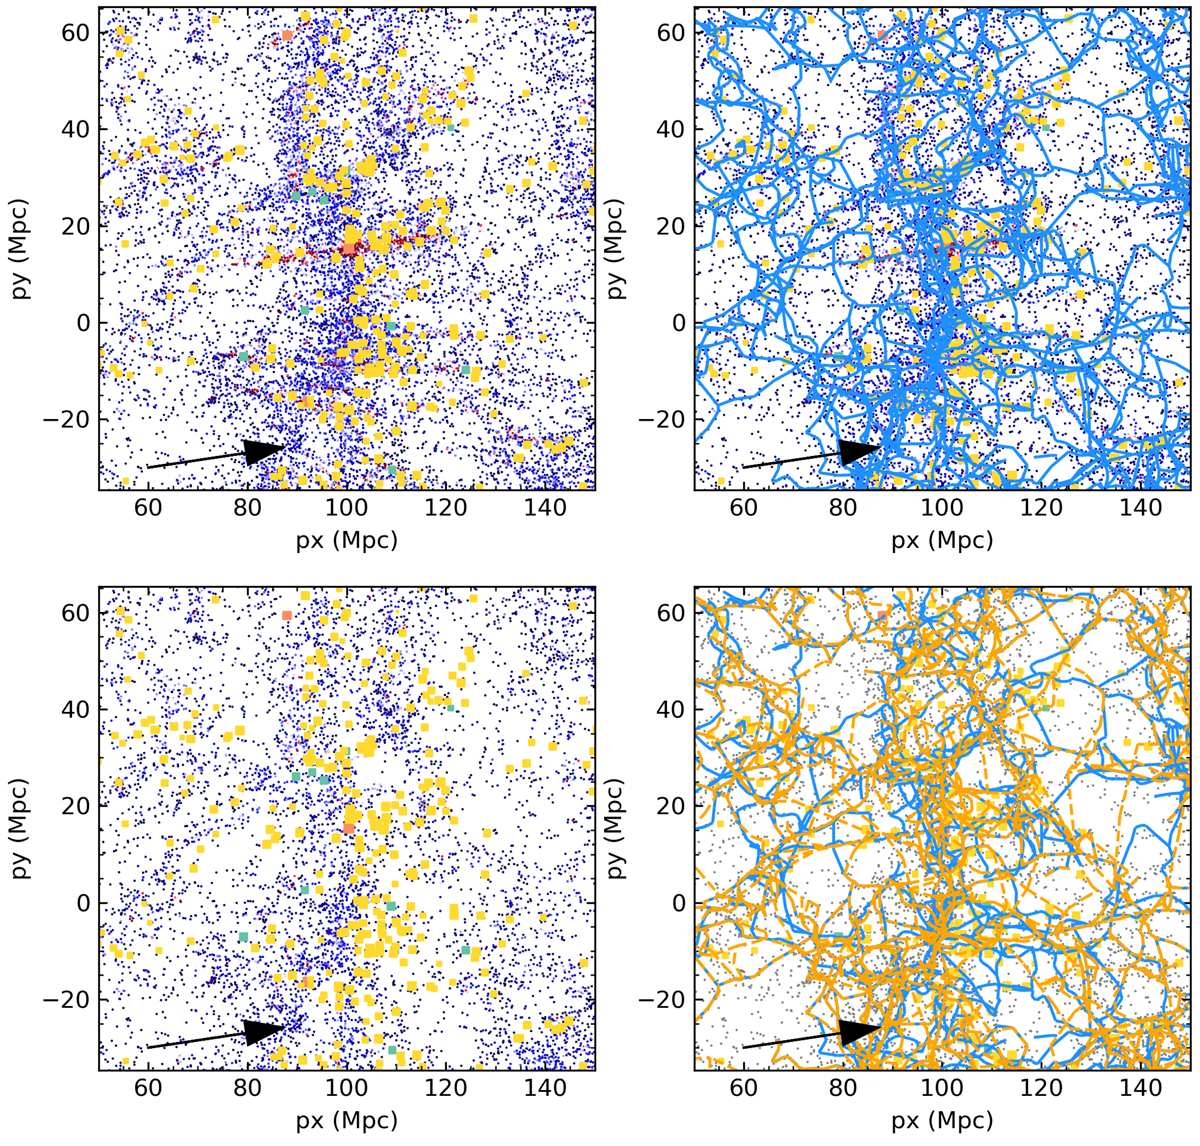
Effect of FoG on the skeleton reconstruction around Coma. The four panels show a 50 × 50 × 50 Mpc3 box centred on the Coma cluster, projected on the Cartesian x − y plane (the x-axis is aligned with redshift and the y-axis with right ascension). In all panels small points correspond to galaxies from the Legacy MGS. In three out of four panels they are colour-coded according to local density. In the top panels, the FoG effect is present in the galaxy distribution, but it has been removed in the bottom panels. In the right panels, the blue skeleton has been derived with the FoG effect, and the dashed orange skeleton has been derived after the FoG effect was removed. Both skeletons have been derived with no smoothing of the density field and a 3σ persistence threshold. In each panel, squares correspond to the clusters we used to eliminate the FoG effect, colour-coded according to the sample to which they belong (not all samples have clusters inside the box; MCXC X-ray clusters are plotted in aqua, Planck SZ clusters in orange, and Tempel et al. 2017 optical clusters in yellow). The size of the squares scales with cluster virial mass. In each panel the black arrow shows the direction of the LoS.
Current usage metrics show cumulative count of Article Views (full-text article views including HTML views, PDF and ePub downloads, according to the available data) and Abstracts Views on Vision4Press platform.
Data correspond to usage on the plateform after 2015. The current usage metrics is available 48-96 hours after online publication and is updated daily on week days.
Initial download of the metrics may take a while.