Fig. 16.
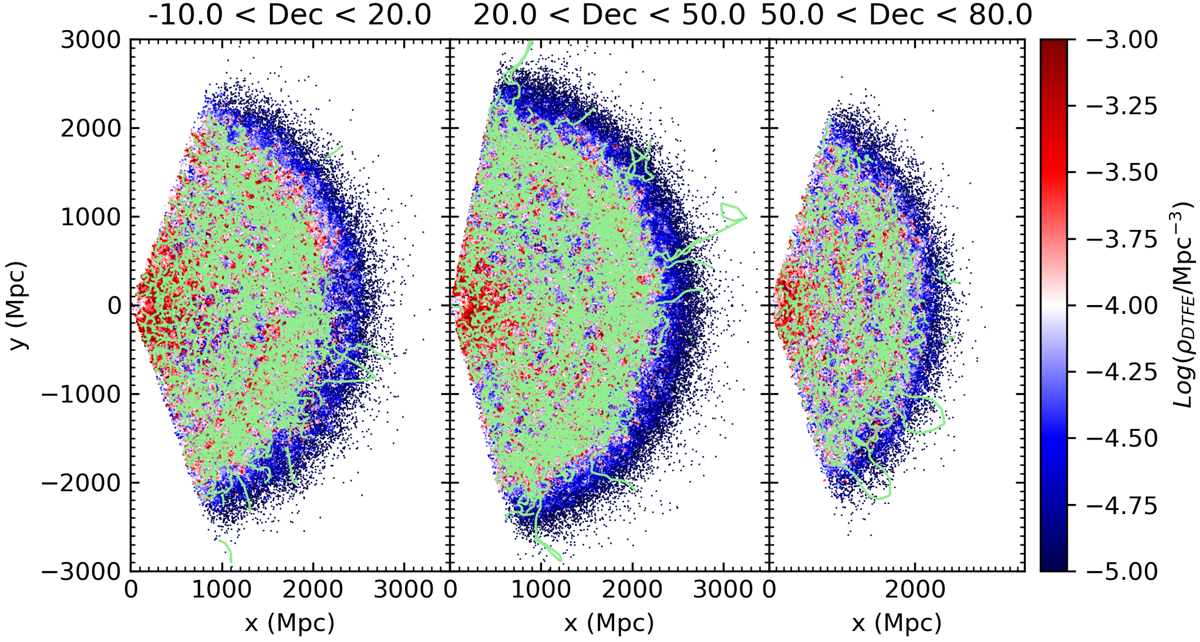
Maps of filaments on a Cartesian x − y plane. The x-axis is aligned with increasing redshift, and the y-axis with increasing right ascension. The galaxy distribution is colour-coded according to local density as measured by the DTFE, and filaments are over-plotted in green. Three ranges of declination are considered for clarity, as marked at the top of each panel. Only the LOWZ+CMASS is considered. As an example, filaments detected with a 3σ persistence threshold and no smoothing of the density field have been reported. No cleaning of the skeleton is performed to show the full distribution of filaments as recovered by DisPerSE.
Current usage metrics show cumulative count of Article Views (full-text article views including HTML views, PDF and ePub downloads, according to the available data) and Abstracts Views on Vision4Press platform.
Data correspond to usage on the plateform after 2015. The current usage metrics is available 48-96 hours after online publication and is updated daily on week days.
Initial download of the metrics may take a while.