Fig. 11.
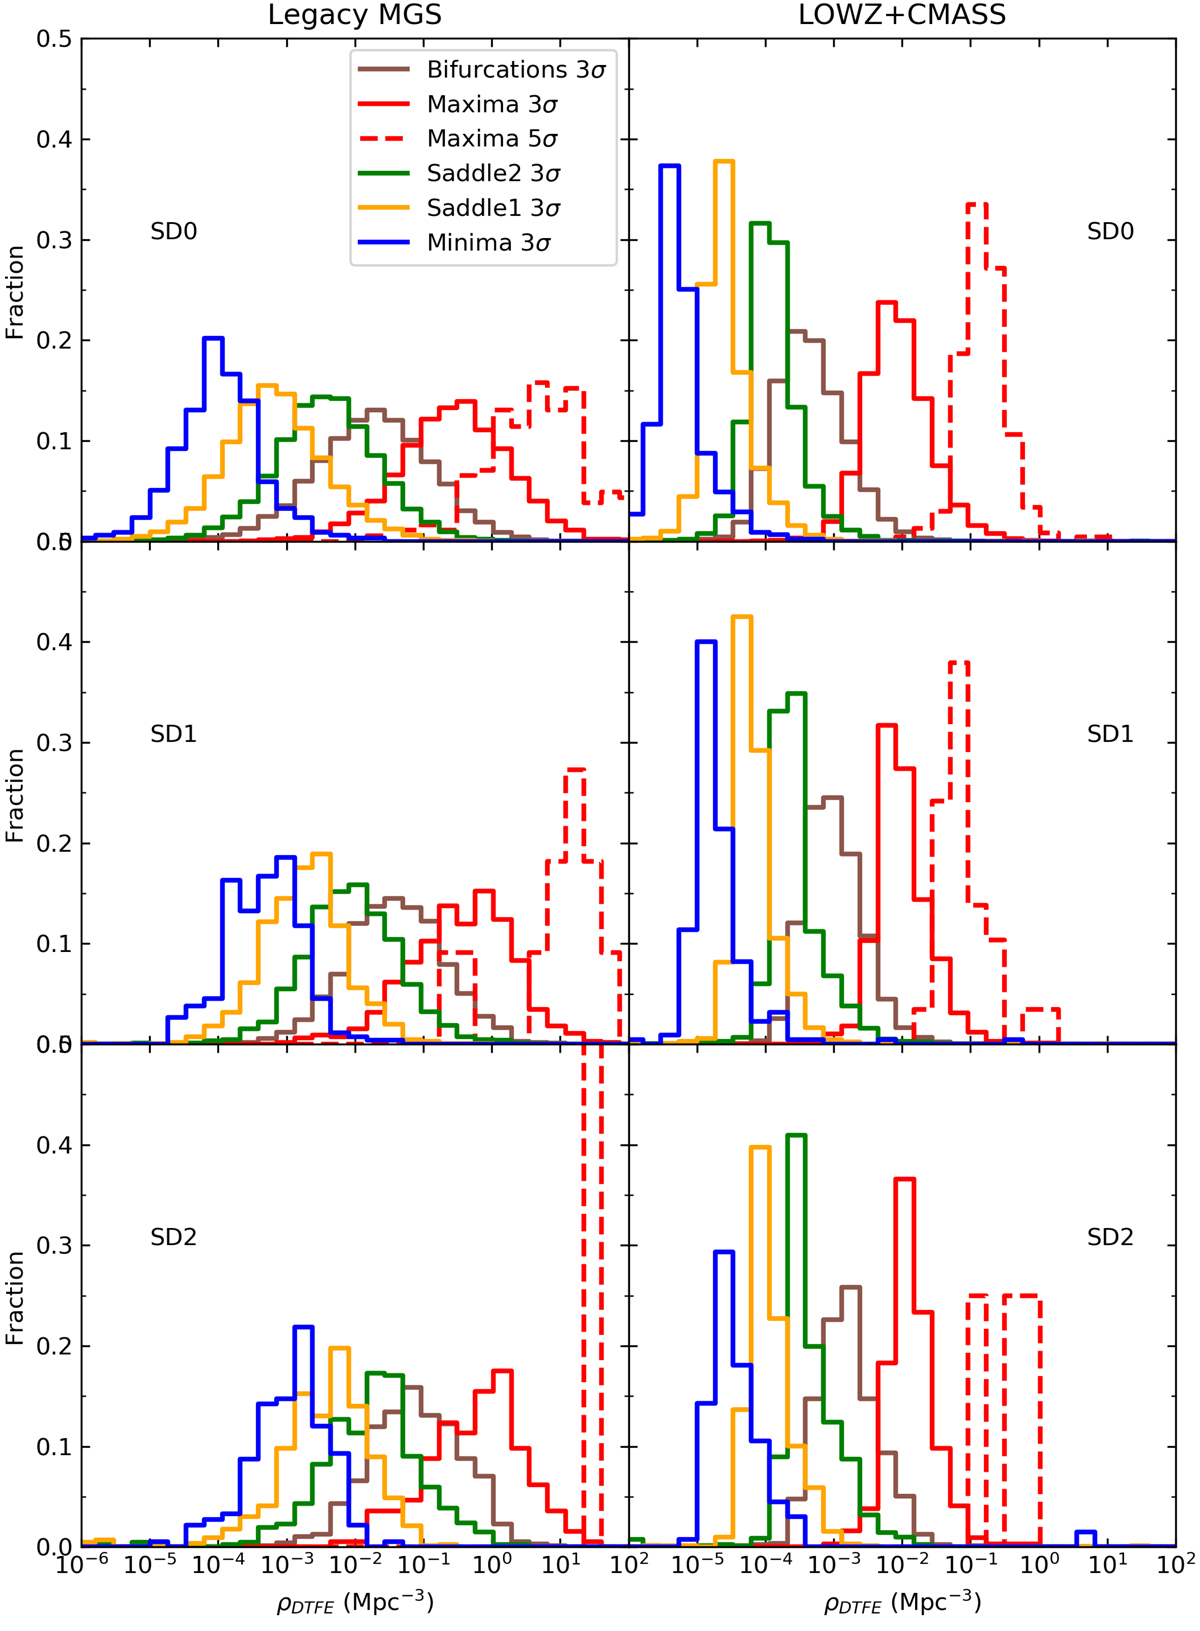
Density distribution of the critical points as derived from the DTFE. The left and right columns refer to the Legacy MGS and LOWZ+CMASS sample, respectively. Rows are different smoothing cycles of the density field prior to filament detection. In each panel, the solid lines refer to maxima (red), bifurcations (brown), type 2 saddles (green), type 1 saddles (yellow), and minima (blue). Only the 3σ persistence threshold case is shown, except for maxima, where the 5σ persistence sample is also reported (dashed red lines). Although indicated as 5σ, the high-persistence cut for LOWZ+CMASS in the one-smoothing case has been limited to 4.5σ.
Current usage metrics show cumulative count of Article Views (full-text article views including HTML views, PDF and ePub downloads, according to the available data) and Abstracts Views on Vision4Press platform.
Data correspond to usage on the plateform after 2015. The current usage metrics is available 48-96 hours after online publication and is updated daily on week days.
Initial download of the metrics may take a while.