Fig. 1.
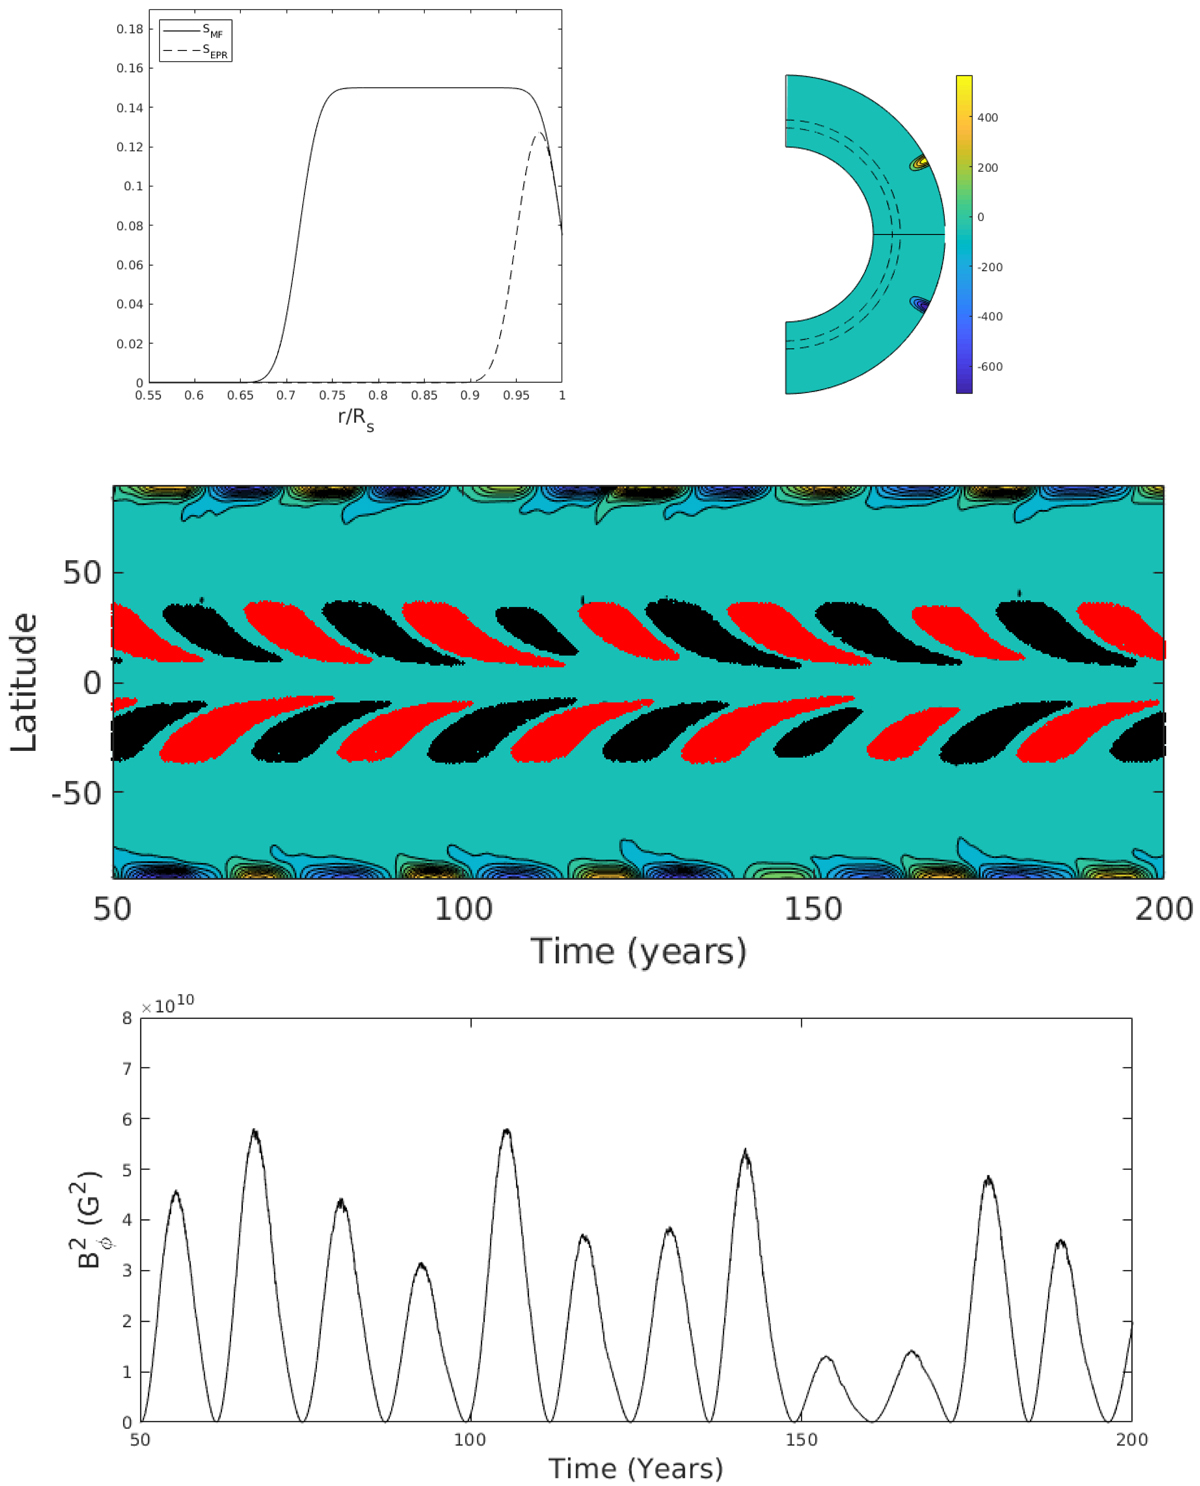
Top panel, left: radial profile of mean-field α-coefficient and the Babcock–Leighton source term due to ephemeral regions. Right: poloidal field line contours obtained from the double-ring algorithm in the northern and southern hemispheres, respectively. Middle panel: butterfly diagram generated from our simulation in the diffusion-dominated region. Bottom panel: typical variation of ![]() at the base of the solar convection zone with time.
at the base of the solar convection zone with time.
Current usage metrics show cumulative count of Article Views (full-text article views including HTML views, PDF and ePub downloads, according to the available data) and Abstracts Views on Vision4Press platform.
Data correspond to usage on the plateform after 2015. The current usage metrics is available 48-96 hours after online publication and is updated daily on week days.
Initial download of the metrics may take a while.