Free Access
Fig. 34.
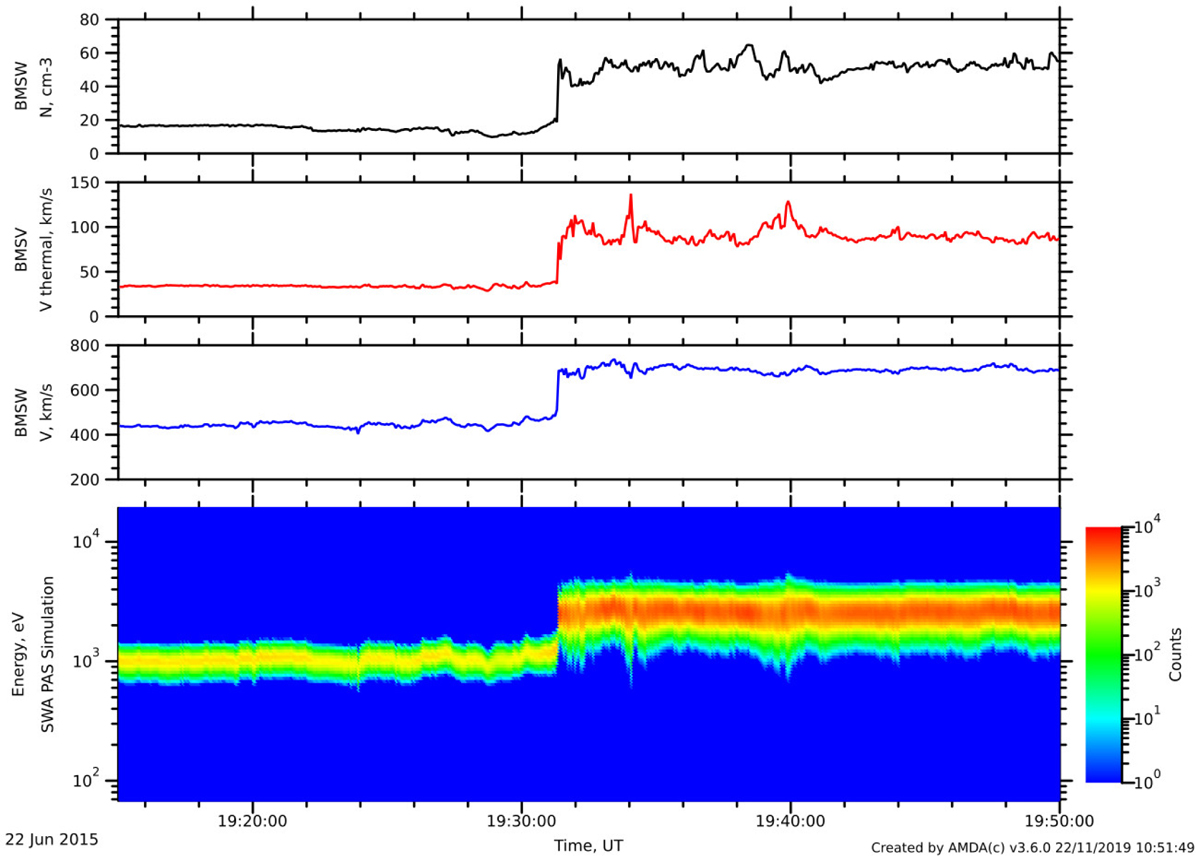
Simulation of a SWA-PAS Energy-Time Spectrogram. Three top panels: input parameters to the simulation as measured by the BMSW instrument onboard the RadioAstron mission. Bottom panel: expected sensor response integrated over all angular bins. The time of the measurements is shifted relative to UT by about 1.5 h.
Current usage metrics show cumulative count of Article Views (full-text article views including HTML views, PDF and ePub downloads, according to the available data) and Abstracts Views on Vision4Press platform.
Data correspond to usage on the plateform after 2015. The current usage metrics is available 48-96 hours after online publication and is updated daily on week days.
Initial download of the metrics may take a while.