Fig. 3.
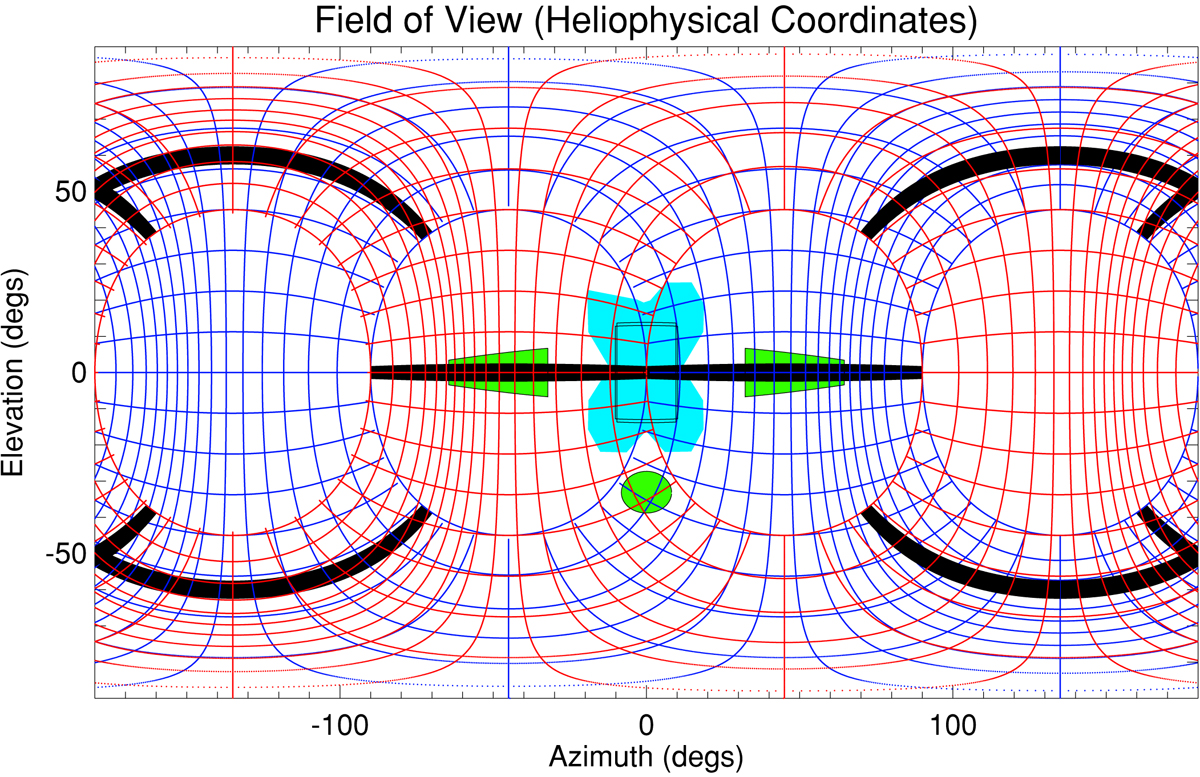
Expected combined FoV for the 2-head SWA-EAS unit. The figure covers the full sky (±90° in elevation and ±180° in azimuth), with the blue grid indicating the regions of sky sampled by SWA-EAS1 and the red grid that sampled by SWA-EAS2. The black bars indicate regions of the sky occluded by sensor structure, in this case the three support pillars on each sensor which are clearly visible in Fig. 4. The green shaded regions indicate the approximate projection of spacecraft appendages in the FoV, namely the solar arrays and the high gain antenna. The blue shaded region indicates the blockage to the FoV due to a boom-mounted baffle designed to shield the instrument from direct impingement of thruster exhausts. (The relative projection of the spacecraft itself is indicated by the rectangle within this latter region).
Current usage metrics show cumulative count of Article Views (full-text article views including HTML views, PDF and ePub downloads, according to the available data) and Abstracts Views on Vision4Press platform.
Data correspond to usage on the plateform after 2015. The current usage metrics is available 48-96 hours after online publication and is updated daily on week days.
Initial download of the metrics may take a while.