Free Access
Fig. 23.
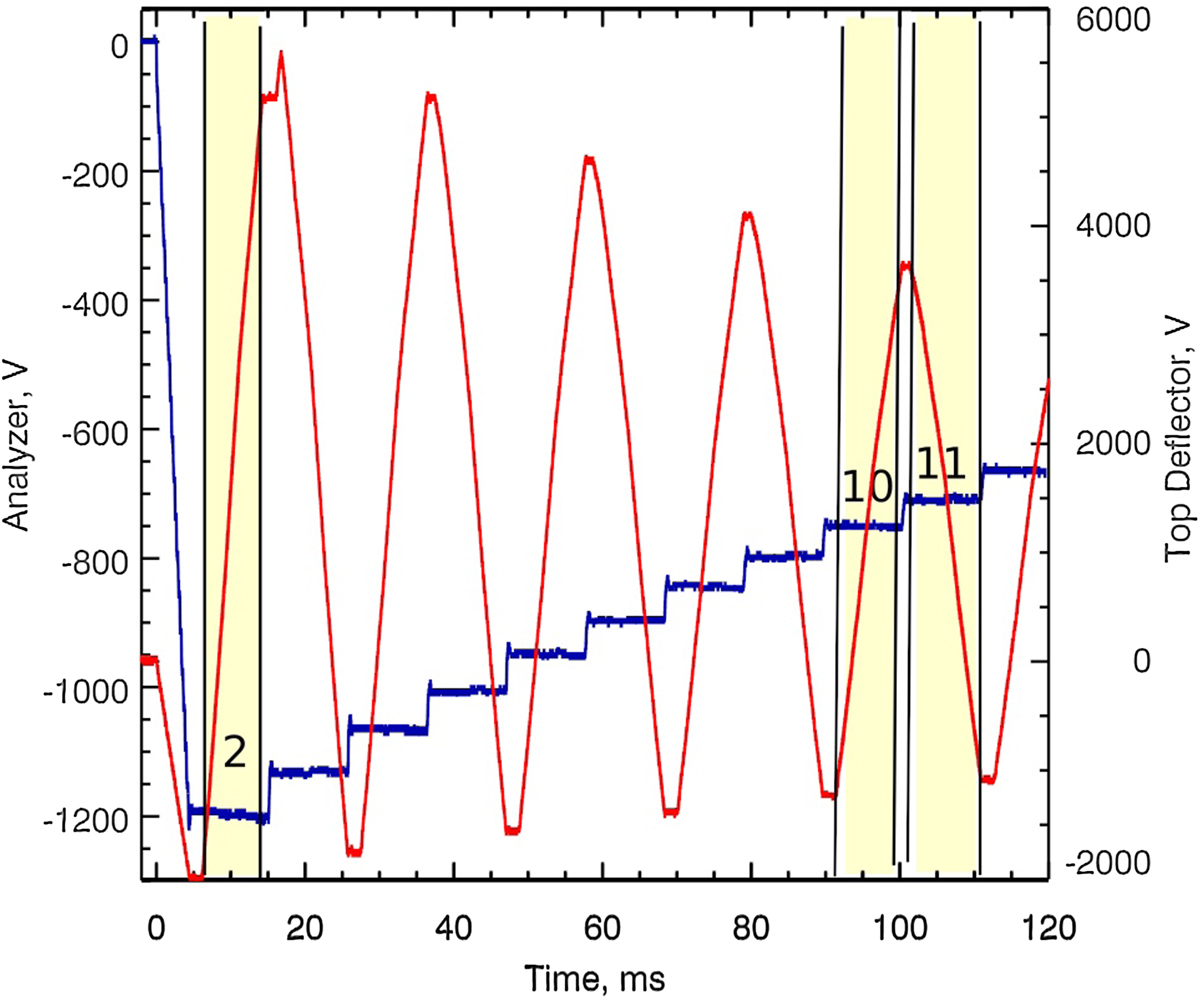
SWA-PAS HVPS waveforms taken at the beginning of a sampling period. Blue trace: energy analyser voltage; red trace: top deflector voltage. The yellow bars show the time intervals for count accumulations.
Current usage metrics show cumulative count of Article Views (full-text article views including HTML views, PDF and ePub downloads, according to the available data) and Abstracts Views on Vision4Press platform.
Data correspond to usage on the plateform after 2015. The current usage metrics is available 48-96 hours after online publication and is updated daily on week days.
Initial download of the metrics may take a while.