Fig. 2.
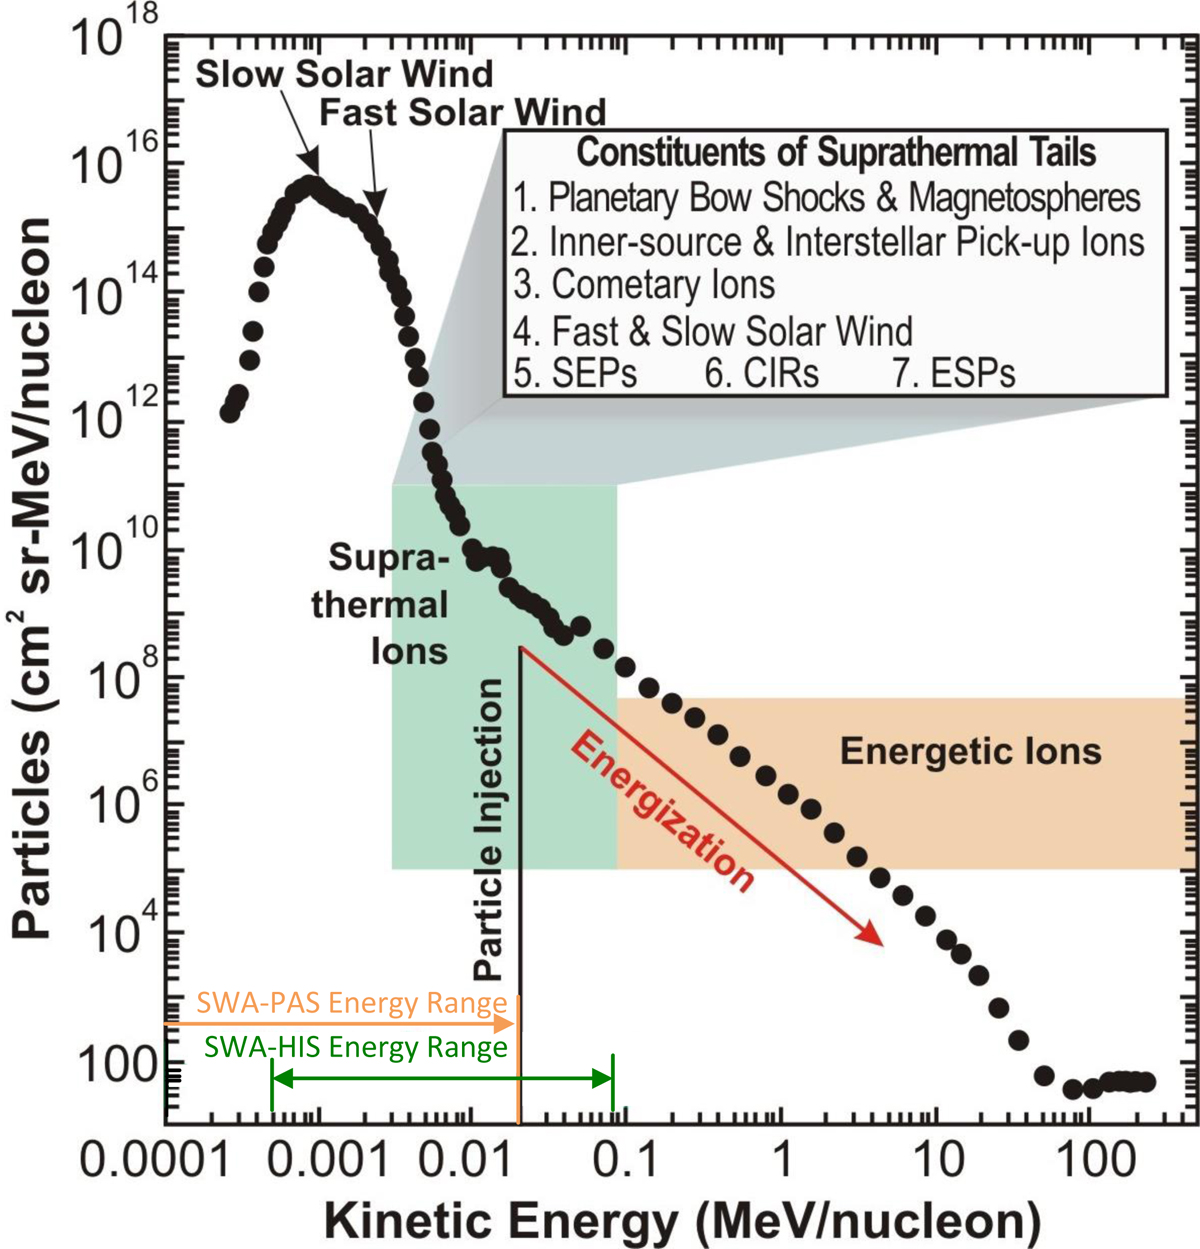
SWA measurement range for the ion composition and energy distribution extending from the solar wind into the suprathermal domain and covering the energy range of SEP seed particles injected to shock acceleration (adapted from Mewaldt et al. 2003; shown here are oxygen fluences from ACE measured over a 3-year period). SWA-PAS and SWA-HIS energy ranges are shown at the bottom of the figure for comparison.
Current usage metrics show cumulative count of Article Views (full-text article views including HTML views, PDF and ePub downloads, according to the available data) and Abstracts Views on Vision4Press platform.
Data correspond to usage on the plateform after 2015. The current usage metrics is available 48-96 hours after online publication and is updated daily on week days.
Initial download of the metrics may take a while.