Fig. 2.
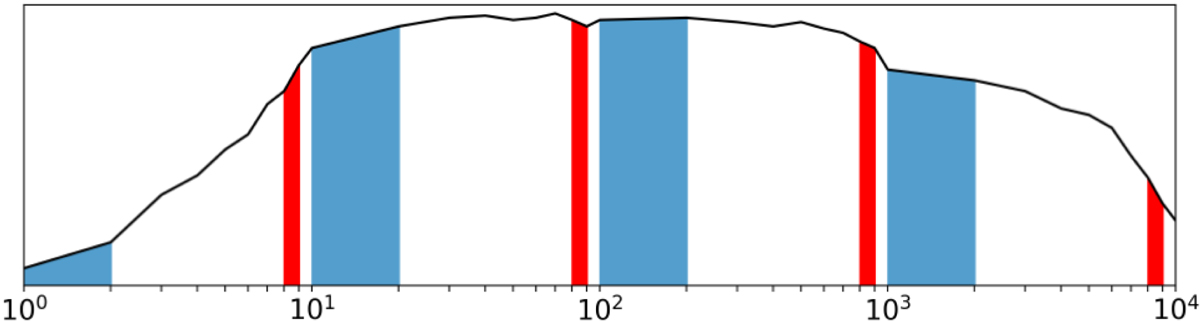
Schematic example of a probability distribution of a variable that covers several orders of magnitude and that is fairly uniformly distributed on a logarithmic scale. The sum of the area of the blue bins is the relative probability that the first significant digit equals 1 (d = 1), while the sum of the area of the red bins is the relative probability that the first significant digit equals 8 (d = 8). Because the distribution is fairly uniform, i.e. the bin heights are roughly the same, the cumulative red and blue areas are foremost proportional to the fixed widths of the red and blue bins, respectively, such that numbers randomly drawn from this distribution will approximate Benford’s law.
Current usage metrics show cumulative count of Article Views (full-text article views including HTML views, PDF and ePub downloads, according to the available data) and Abstracts Views on Vision4Press platform.
Data correspond to usage on the plateform after 2015. The current usage metrics is available 48-96 hours after online publication and is updated daily on week days.
Initial download of the metrics may take a while.