Fig. B.1.
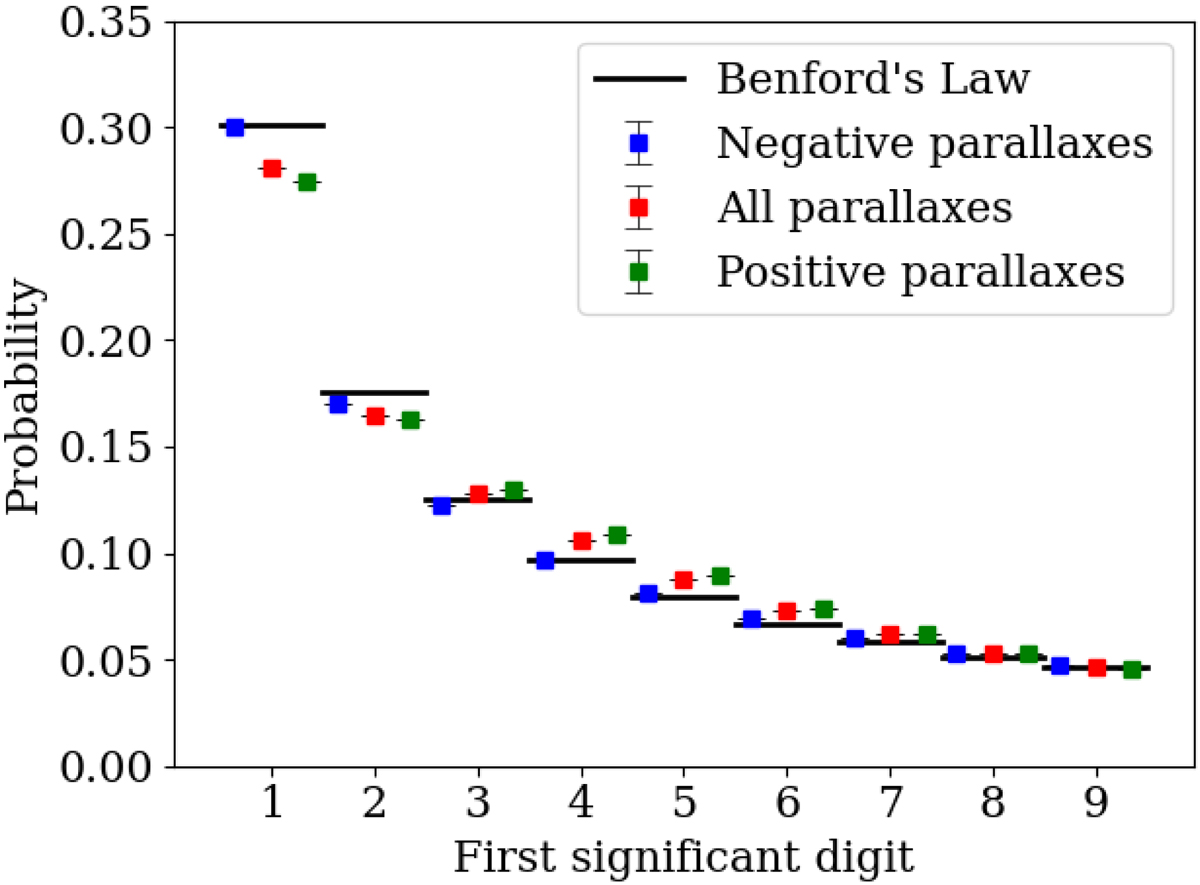
Distribution of the first significant digit of the Gaia DR2 parallaxes together with the theoretical prediction of Benford’s law. Blue points refer to negative parallaxes (for which the statistics is based on the absolute value of the parallaxes), green points refer to positive parallaxes, and red points refer to the absolute value of all parallaxes (the red data can hence be considered as a weighted mean of the blue and green data with weights 18% and 82%, respectively). The data have vertical error bars to reflect Poisson statistics, but the error bars are much smaller than the symbol sizes.
Current usage metrics show cumulative count of Article Views (full-text article views including HTML views, PDF and ePub downloads, according to the available data) and Abstracts Views on Vision4Press platform.
Data correspond to usage on the plateform after 2015. The current usage metrics is available 48-96 hours after online publication and is updated daily on week days.
Initial download of the metrics may take a while.