Fig. 13.
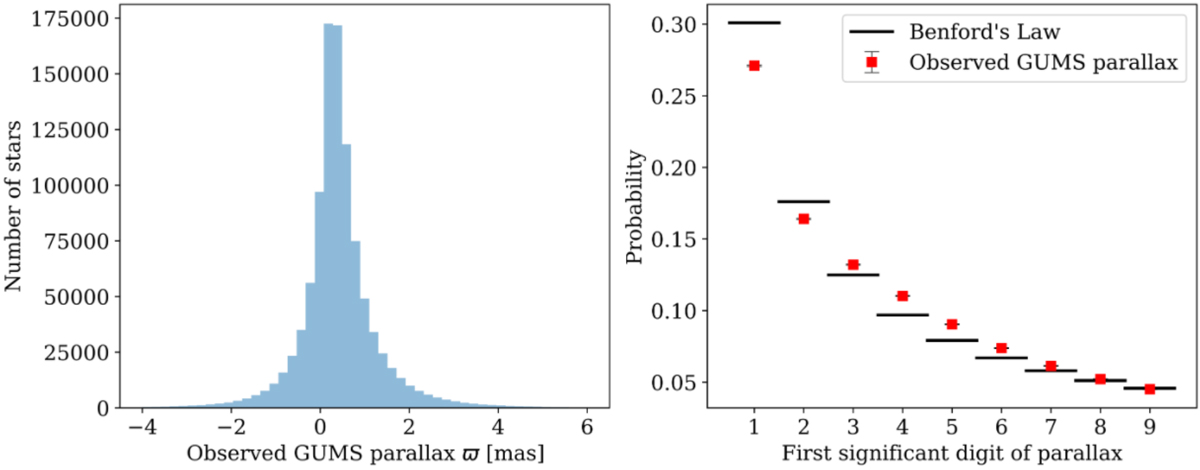
Left: histogram of the simulated observed GUMS parallaxes from Luri et al. (2014); 4879 objects fall outside the plotted range. Right: distribution of their first significant digit together with the theoretical prediction of Benford’s law. The data have vertical error bars to reflect Poisson statistics, but the error bars are much smaller than the symbol sizes. Figure 5 shows the same contents, but using the Gaia DR2 parallaxes.
Current usage metrics show cumulative count of Article Views (full-text article views including HTML views, PDF and ePub downloads, according to the available data) and Abstracts Views on Vision4Press platform.
Data correspond to usage on the plateform after 2015. The current usage metrics is available 48-96 hours after online publication and is updated daily on week days.
Initial download of the metrics may take a while.