Free Access
Fig. 4.
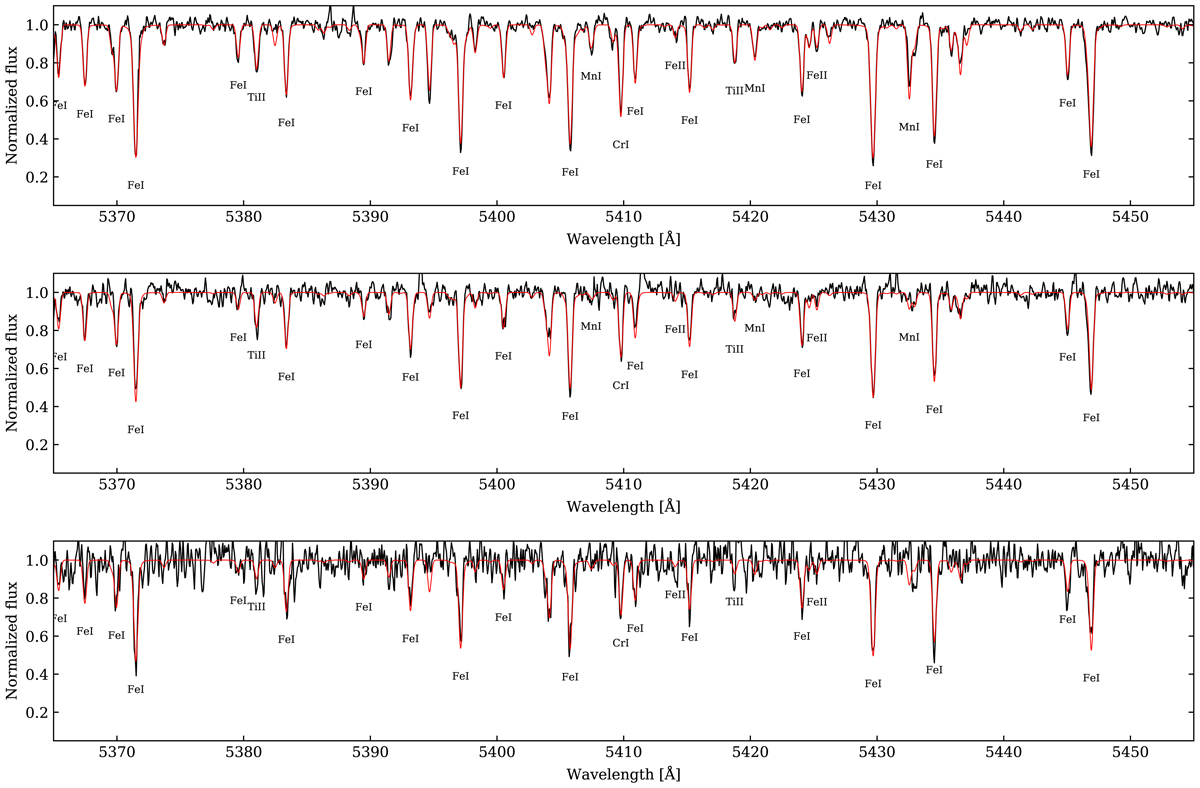
Part of the HR10 spectrum of S08-6 (top), S08-242 (middle) and S05-67 (bottom) in black with their synthetic best fits over-plotted in red. A set of lines used in abundance determination are indicated for each star. The stars are ranked from top to bottom by decreasing signal-to-noise ratios: 83, 38, and 23.
Current usage metrics show cumulative count of Article Views (full-text article views including HTML views, PDF and ePub downloads, according to the available data) and Abstracts Views on Vision4Press platform.
Data correspond to usage on the plateform after 2015. The current usage metrics is available 48-96 hours after online publication and is updated daily on week days.
Initial download of the metrics may take a while.