Fig. 11.
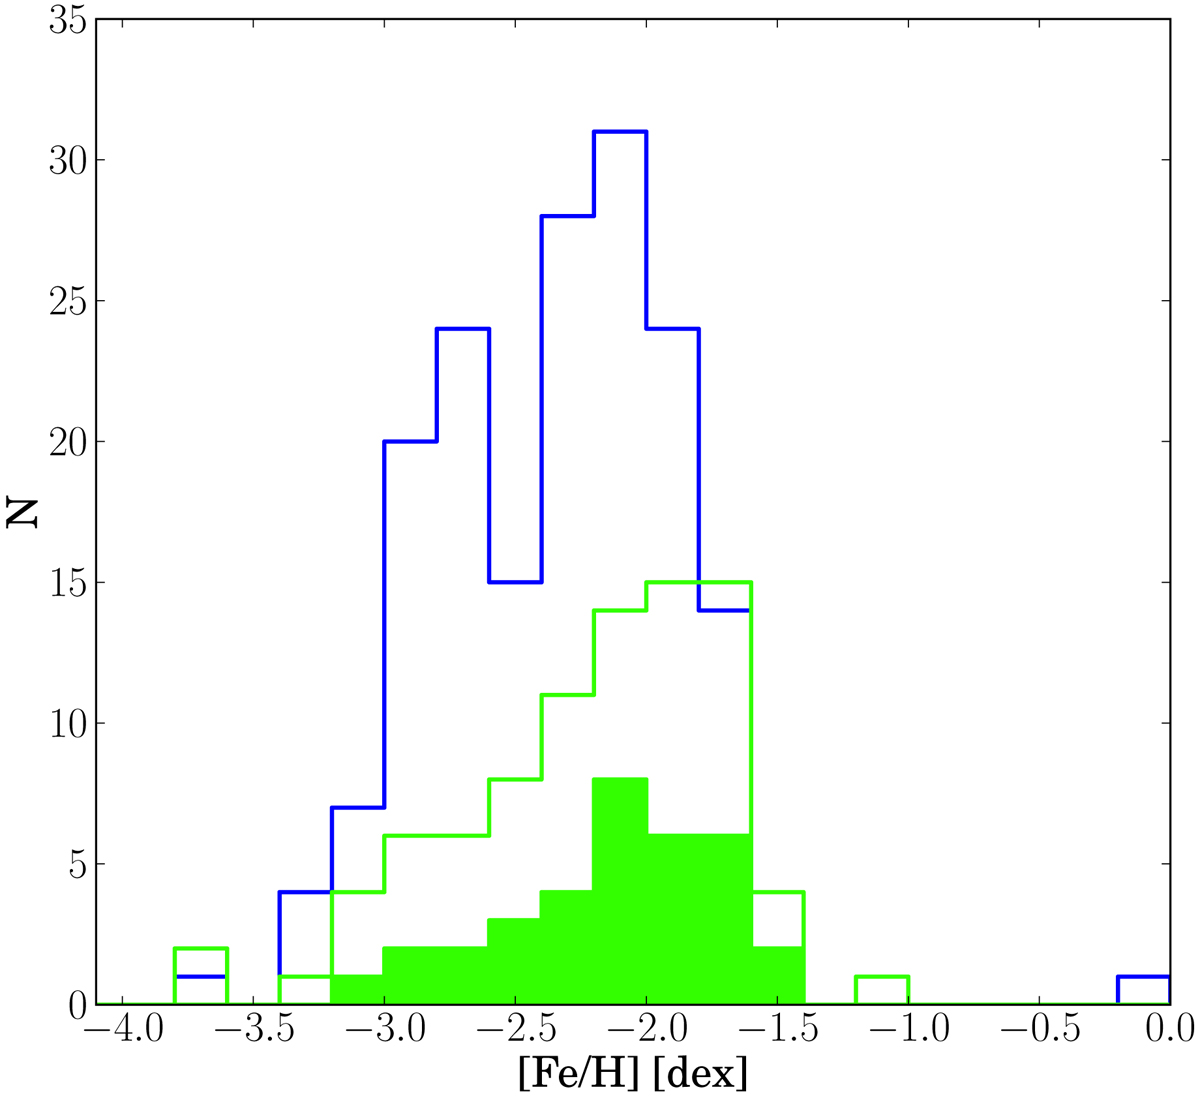
Metallicity distribution function of the Sextans stars. Following the same colour code as in Figs. 1 and 2. The blue solid line corresponds to the probable members of the CaT DART sample (Battaglia et al. 2011), while the green solid line shows our high-resolution sample. The filled green area corresponds to the subsample of our members previously studied in CaT.
Current usage metrics show cumulative count of Article Views (full-text article views including HTML views, PDF and ePub downloads, according to the available data) and Abstracts Views on Vision4Press platform.
Data correspond to usage on the plateform after 2015. The current usage metrics is available 48-96 hours after online publication and is updated daily on week days.
Initial download of the metrics may take a while.