Fig. 1.
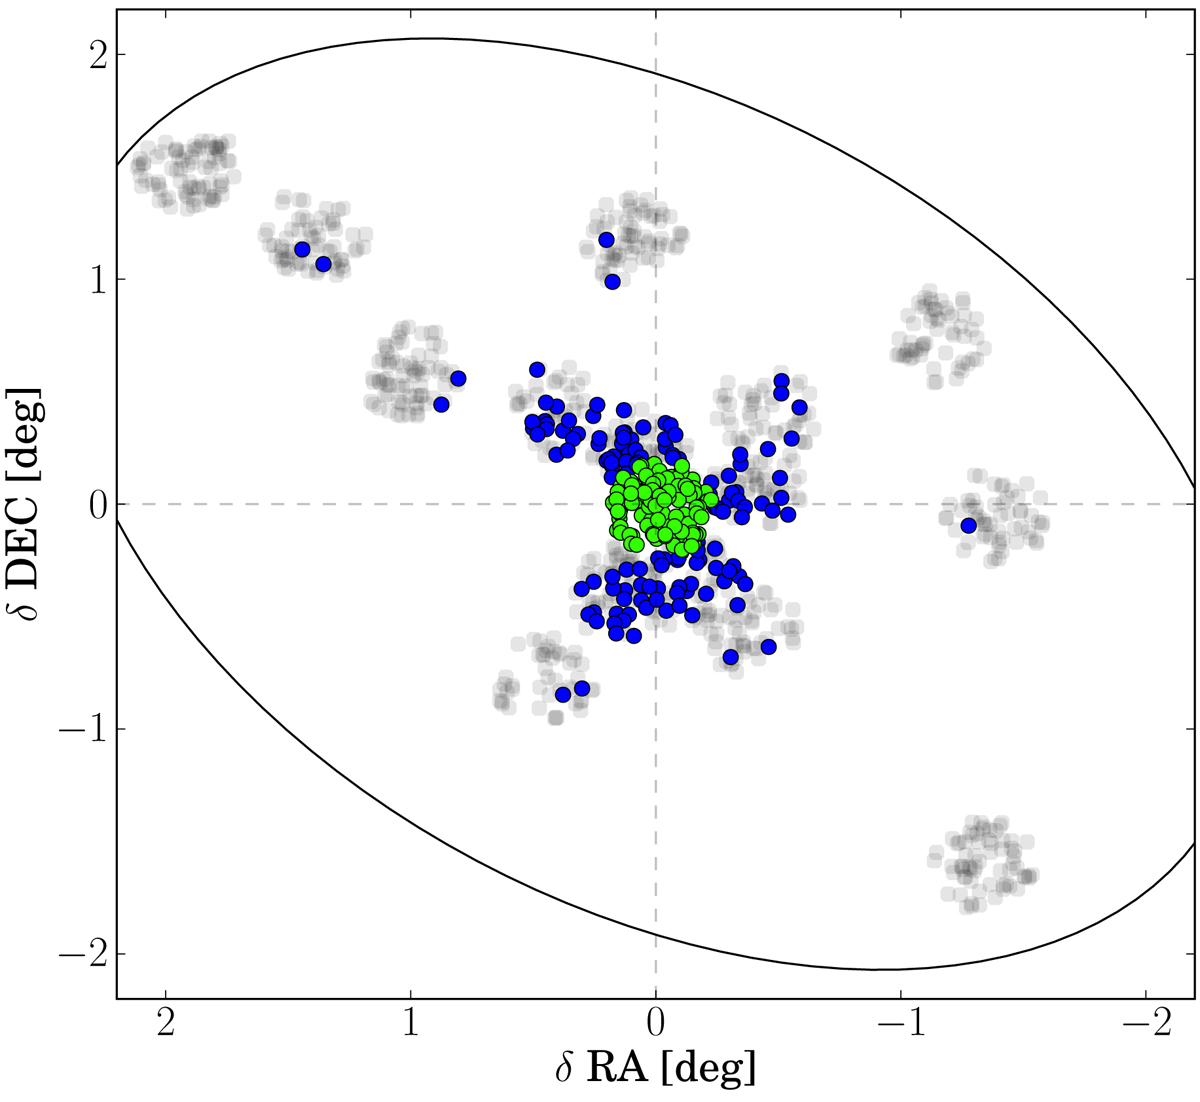
Spatial distribution of the DART spectroscopic observations in Sextans. The grey points show the stars observed around the CaT survey (Battaglia et al. 2011). The blue circles correspond to the probable members of this medium-resolution sample, while the green points are the stars of our high-resolution sample (see Table 2 for the values of RA and Dec). The black ellipse represents the tidal radius of Sextans calculated by Cicuéndez et al. (2018).
Current usage metrics show cumulative count of Article Views (full-text article views including HTML views, PDF and ePub downloads, according to the available data) and Abstracts Views on Vision4Press platform.
Data correspond to usage on the plateform after 2015. The current usage metrics is available 48-96 hours after online publication and is updated daily on week days.
Initial download of the metrics may take a while.