Fig. 9.
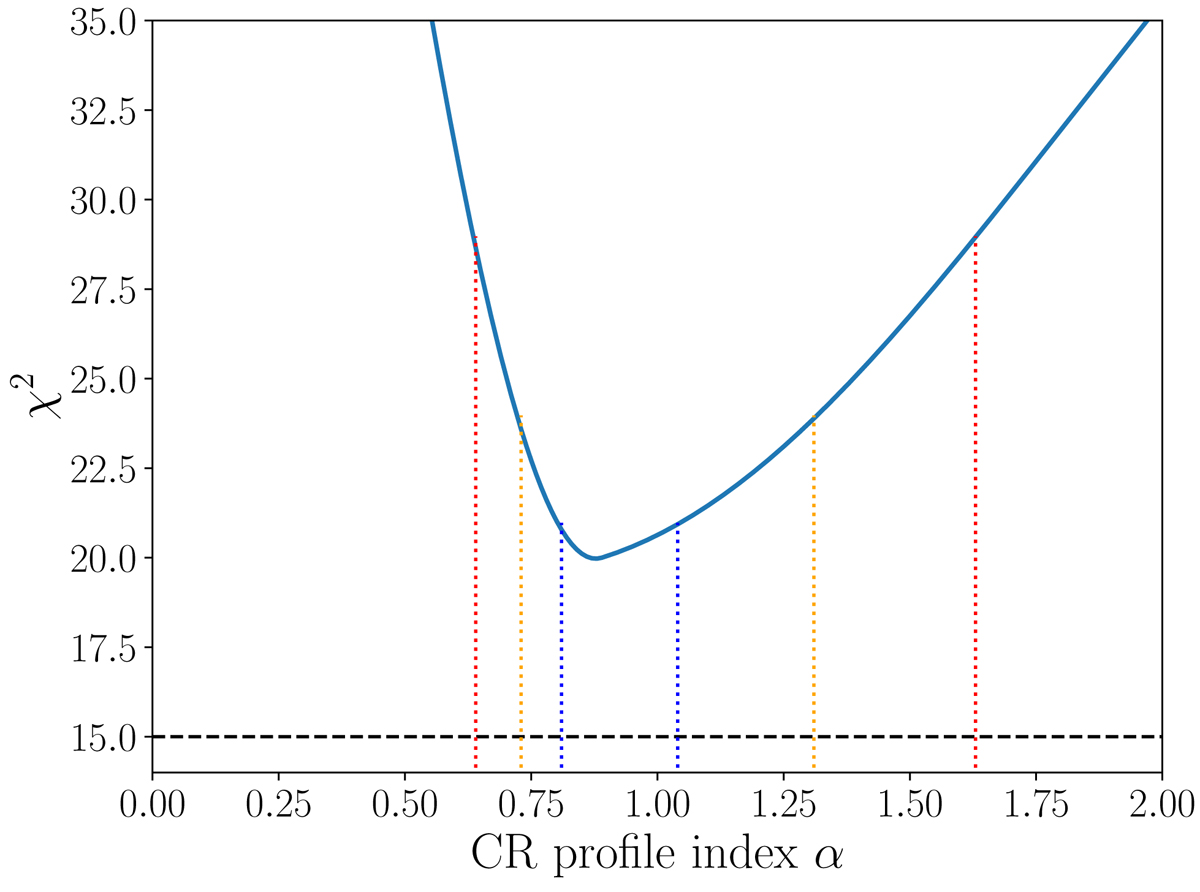
Scan of the cosmic-ray density profile power-law index α with respect to the data in Fig. 4 and earlier measurements from H.E.S.S. Collaboration (2016). The vertical dashed lines mark the derived 1 (blue), 2 (orange) and 3σ (red) confidence intervals. The horizontal dashed line represent the number of degrees of freedom in the fit. The scanned value, α corresponds to the true 3D cosmic-ray distribution and is projected on the plane of the sky using an assumed 3D gas map. See Sect. 4.2 for details.
Current usage metrics show cumulative count of Article Views (full-text article views including HTML views, PDF and ePub downloads, according to the available data) and Abstracts Views on Vision4Press platform.
Data correspond to usage on the plateform after 2015. The current usage metrics is available 48-96 hours after online publication and is updated daily on week days.
Initial download of the metrics may take a while.