Fig. 8.
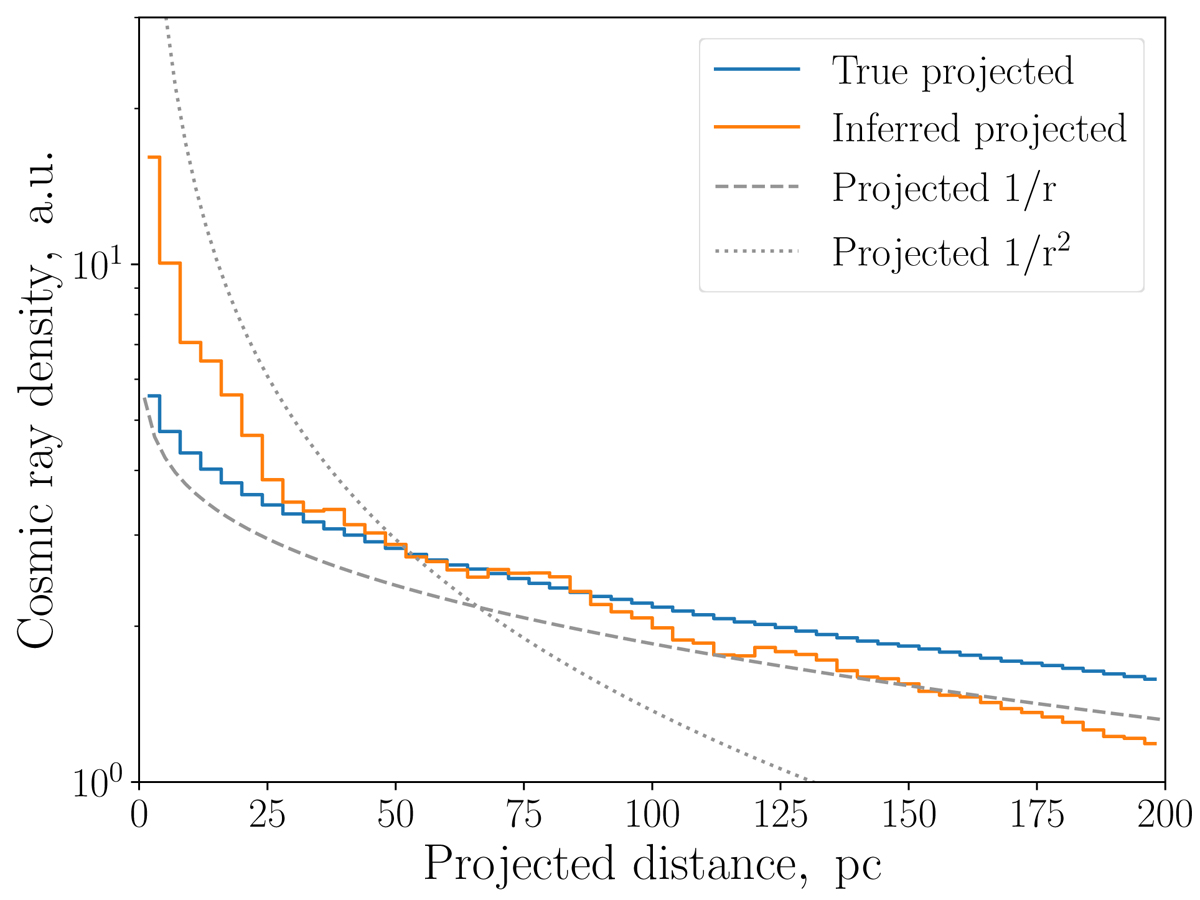
Projected cosmic-ray density as a function of the distance from the GC, computed using a 3D reconstruction of the gas distribution in the region. The underlining profile is assumed to have a ρCR ∝ r−1 shape. Blue line shows the true projection, whereas the orange one depicts the ![]() estimate. Dashed and dotted grey lines represent the exact solutions for the α = {1, 2} cases respectively, arbitrarily scaled to fit the image. The calculation was performed for the ±10 pc Galactic latitude slice along the Galactic plane.
estimate. Dashed and dotted grey lines represent the exact solutions for the α = {1, 2} cases respectively, arbitrarily scaled to fit the image. The calculation was performed for the ±10 pc Galactic latitude slice along the Galactic plane.
Current usage metrics show cumulative count of Article Views (full-text article views including HTML views, PDF and ePub downloads, according to the available data) and Abstracts Views on Vision4Press platform.
Data correspond to usage on the plateform after 2015. The current usage metrics is available 48-96 hours after online publication and is updated daily on week days.
Initial download of the metrics may take a while.