Fig. 7.
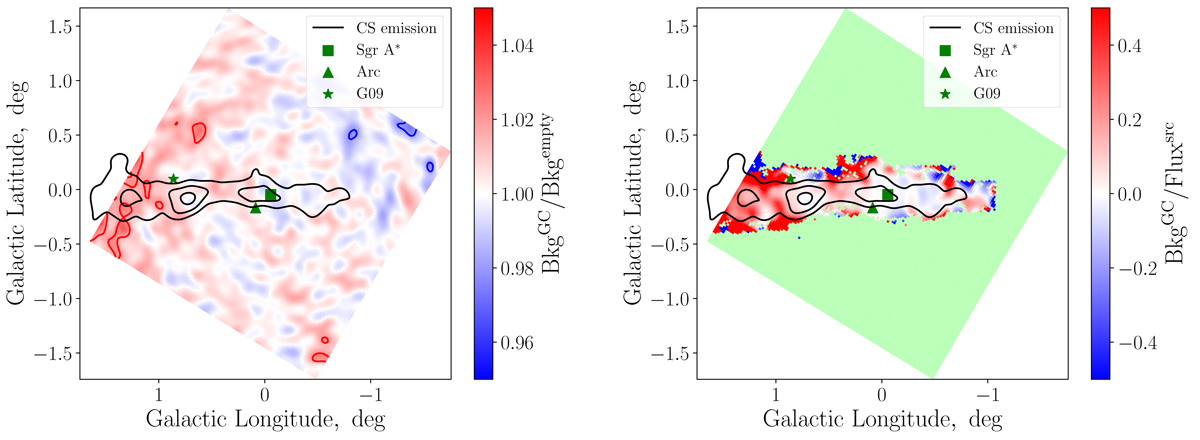
Left: background bias (in units of the true assumed background flux Bkgempty) for the applied background reconstruction technique, estimated with simulations. The map was smeared with the Gaussian kernel with σ = 0.05°; contours indicate ±2% differences with respect to the reference value of 1. Also plotted are the positions of the known γ-ray sources in the Galactic center region as well as the CS emission contours from Tsuboi et al. (1999), corresponding to the integral antenna temperatures of 5, 10 and 15 K, smeared with the same Gaussian kernel. Right: same, but in units of the source flux for the assumed model. Here, only the uncertainties within the region of the used CS gas map are plotted, as the rest of the modelled image contains only background. Such background-only regions are filled with light green.
Current usage metrics show cumulative count of Article Views (full-text article views including HTML views, PDF and ePub downloads, according to the available data) and Abstracts Views on Vision4Press platform.
Data correspond to usage on the plateform after 2015. The current usage metrics is available 48-96 hours after online publication and is updated daily on week days.
Initial download of the metrics may take a while.