Fig. 6.
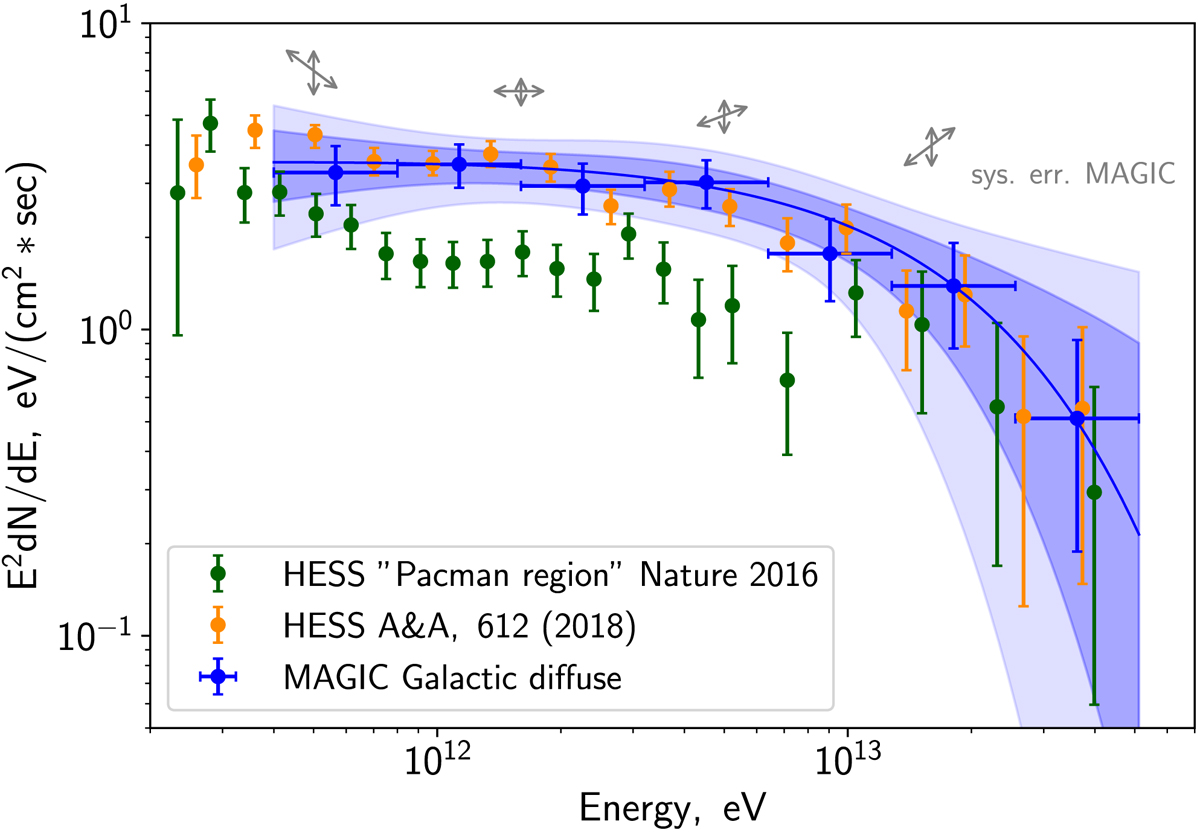
Spectrum of the diffuse Galactic emission, derived from MAGIC data. Dark and light-blue regions mark the 68% and 95% confidence ranges for the assumed power-law with exponential cut-off model. The diffuse spectrum from H.E.S.S. Collaboration (2018), extracted from a similar region, is shown in orange, while the SED obtained from a cut annulus with 0.45 deg outer radius from H.E.S.S. Collaboration (2016) is shown in green. Gray arrows indicate the possible shifts due to the systematical uncertainties in the analysis, similar to Fig. 5.
Current usage metrics show cumulative count of Article Views (full-text article views including HTML views, PDF and ePub downloads, according to the available data) and Abstracts Views on Vision4Press platform.
Data correspond to usage on the plateform after 2015. The current usage metrics is available 48-96 hours after online publication and is updated daily on week days.
Initial download of the metrics may take a while.