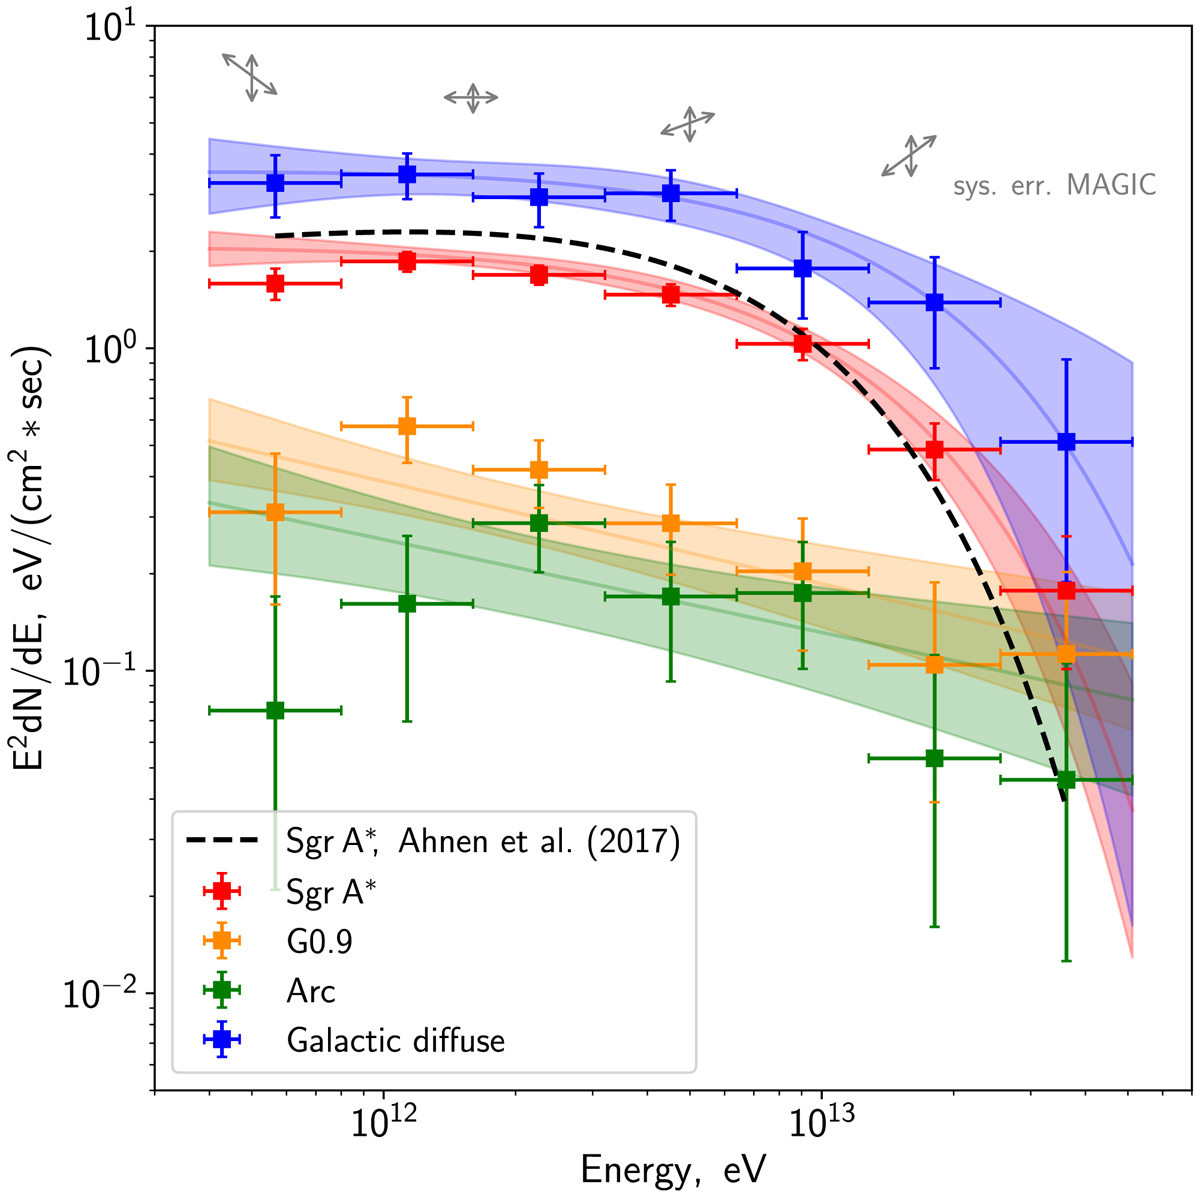
Fig. 5.

MAGIC SEDs of the different components in our model, data points and forward folding fit results (colored bands). For the components corresponding to Sgr A*, the “Arc” and the CR/MC component a power-law shape with exponential cut-off has been used while G0.9+0.1 can be described with a simple power-law. The error bars and bands were computed from the MCMC samples and correspond to 68% confidence range. No spectral unfolding has been applied to the data points, but the effect of spillovers due to energy migration has been corrected for, based on the spectral shapes. Gray arrows indicate the size (length) and direction (orientation) of the SED shifts due to the systematical uncertainties in the analysis (see Sect. 3.4 for details).
Current usage metrics show cumulative count of Article Views (full-text article views including HTML views, PDF and ePub downloads, according to the available data) and Abstracts Views on Vision4Press platform.
Data correspond to usage on the plateform after 2015. The current usage metrics is available 48-96 hours after online publication and is updated daily on week days.
Initial download of the metrics may take a while.


