Fig. 1.
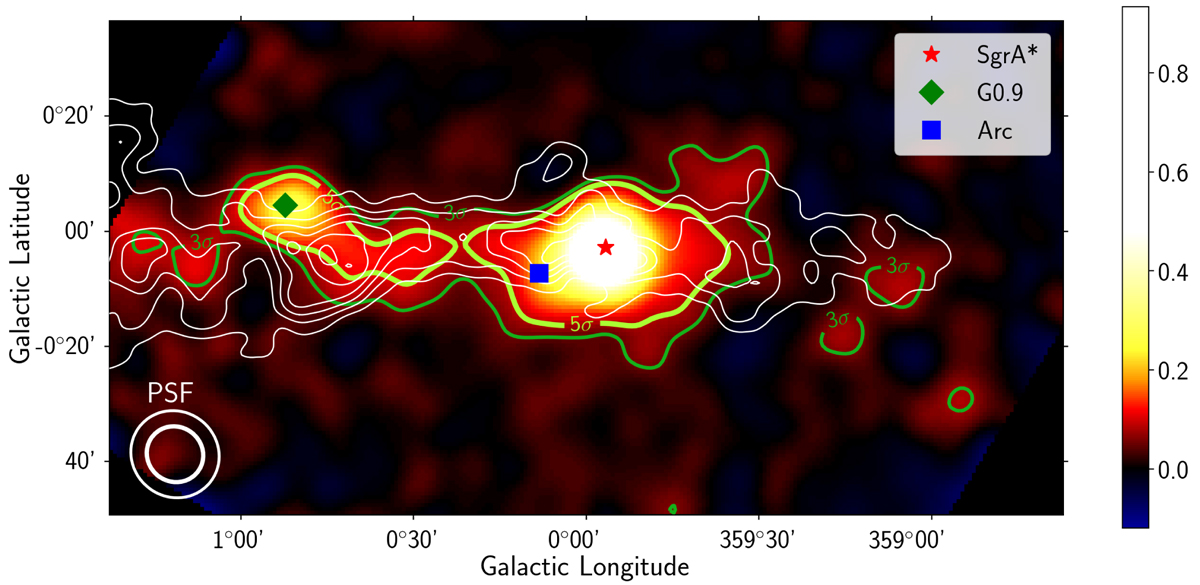
Sky map (excess in units of background) of the GC region in Galactic coordinates at energies above 1 TeV, smeared with a kernel resembling the MAGIC PSF. The pre-trial statistical significance of regions with excess counts is highlighted by green contours at the levels 5σ and 3σ. The (smeared) MAGIC PSF is indicated by 39% and 68% containment contours. The white contours show radio line emission from CS molecules, tracing dense gas (Tsuboi et al. 1999).
Current usage metrics show cumulative count of Article Views (full-text article views including HTML views, PDF and ePub downloads, according to the available data) and Abstracts Views on Vision4Press platform.
Data correspond to usage on the plateform after 2015. The current usage metrics is available 48-96 hours after online publication and is updated daily on week days.
Initial download of the metrics may take a while.