Fig. 7.
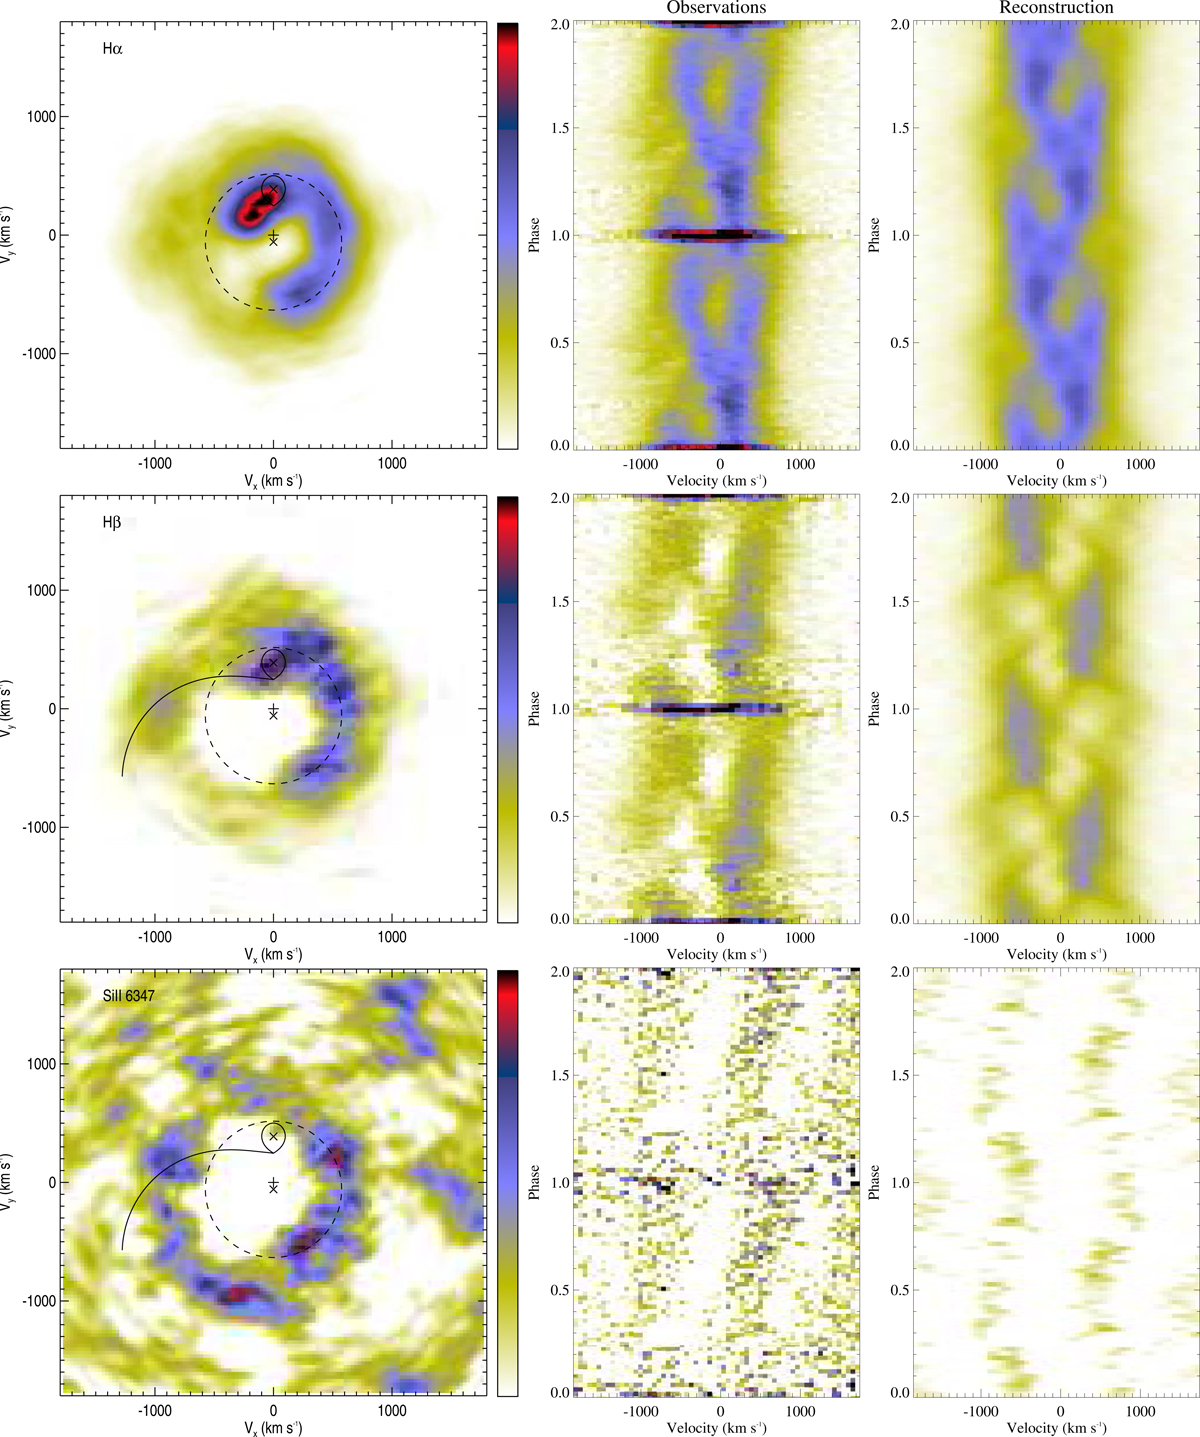
Doppler maps and corresponding observed and reconstructed trailed spectra of the Hα, Hβ, and Si II 6347 emission lines. The position of the WD (lower cross), the centre of mass of the binary (middle cross), the Roche lobe of the secondary star (upper bubble with the cross), and the predicted trajectory of the gas stream in the form of the curve are marked. The circle shows the tidal truncation radius rmax of the accretion disc, assuming a circular Keplerian flow. The colour bars indicate normalised flux on a linear scale.
Current usage metrics show cumulative count of Article Views (full-text article views including HTML views, PDF and ePub downloads, according to the available data) and Abstracts Views on Vision4Press platform.
Data correspond to usage on the plateform after 2015. The current usage metrics is available 48-96 hours after online publication and is updated daily on week days.
Initial download of the metrics may take a while.