Fig. 5.
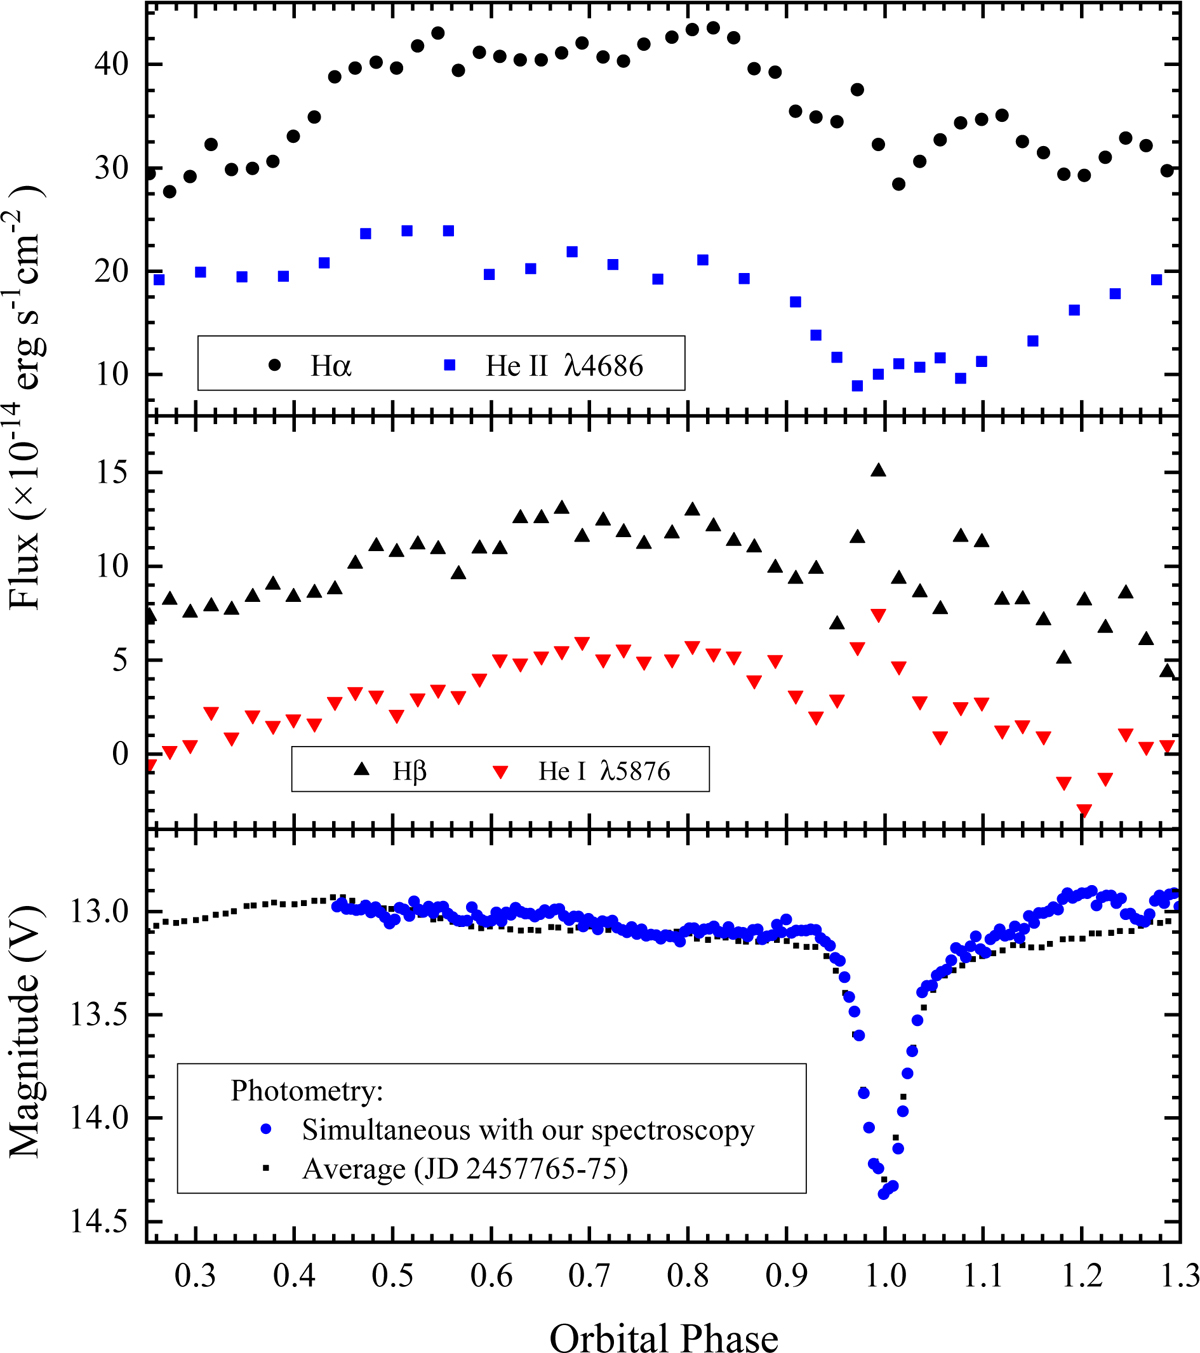
Light curves computed for the Hα, He IIλ4686, Hβ, and He Iλ5876 lines (top and middle panels). The bottom panel shows the AAVSO light curves. The black squares represent the phase-averaged data obtained between JD 2457765 and 2457775, and the blue circles show the light curve of these data at the time of our spectroscopic observations.
Current usage metrics show cumulative count of Article Views (full-text article views including HTML views, PDF and ePub downloads, according to the available data) and Abstracts Views on Vision4Press platform.
Data correspond to usage on the plateform after 2015. The current usage metrics is available 48-96 hours after online publication and is updated daily on week days.
Initial download of the metrics may take a while.