Free Access
Fig. 4.
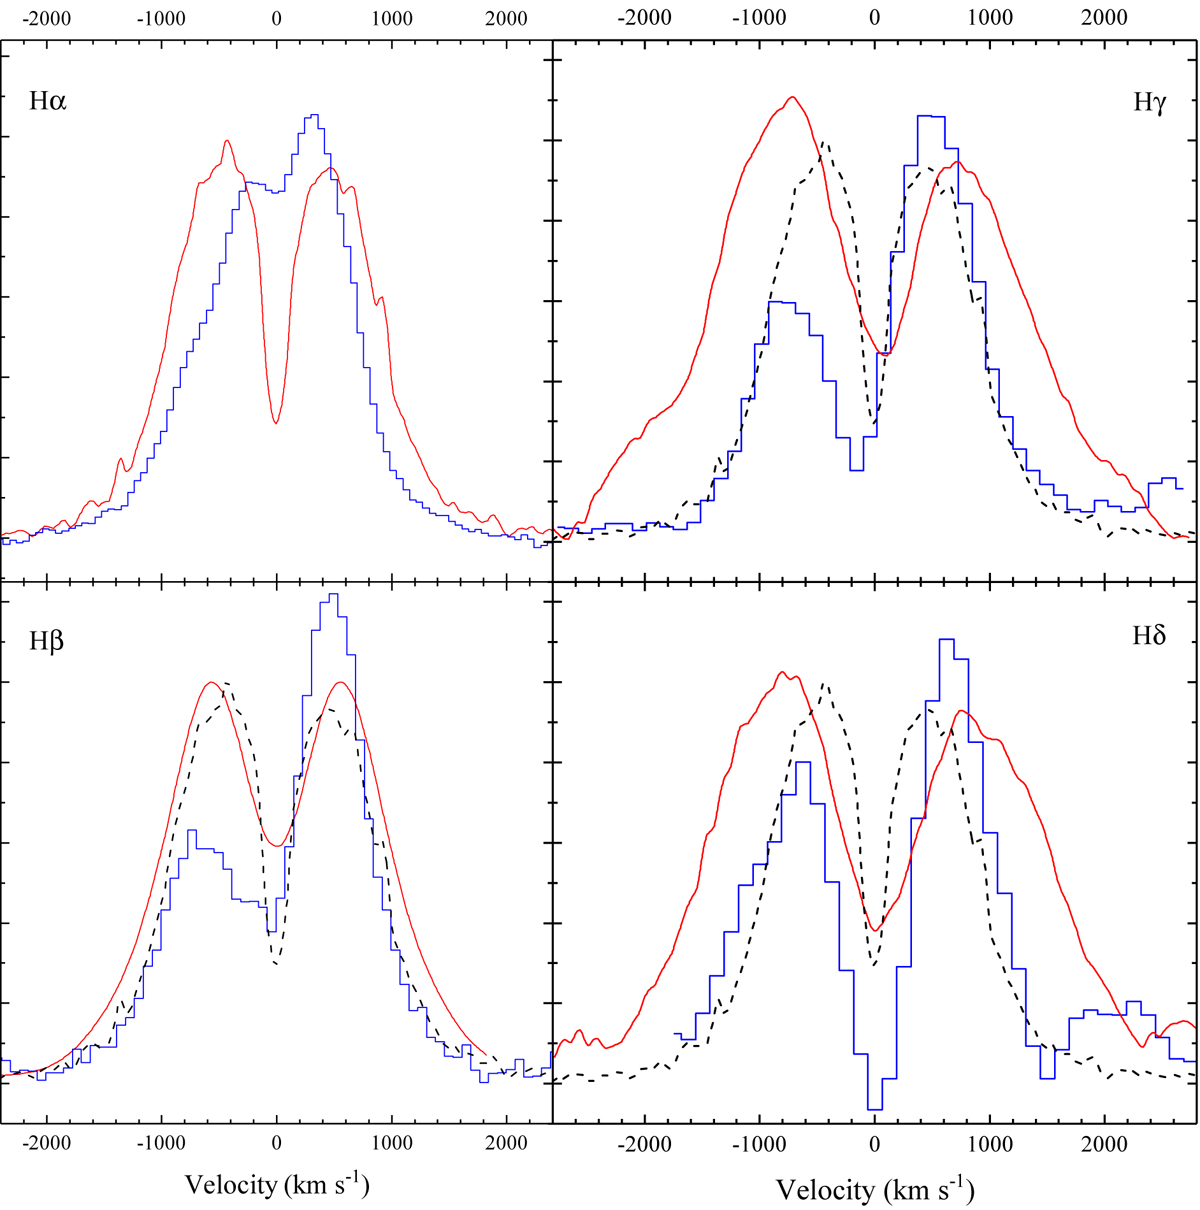
Averaged profiles of the Balmer lines during the 2017 superoutburst (blue) and in quiescence (2005), shown in red. Hβ, Hγ, and Hδ are also compared with the Hα quiescence profile shown by the dashed black line.
Current usage metrics show cumulative count of Article Views (full-text article views including HTML views, PDF and ePub downloads, according to the available data) and Abstracts Views on Vision4Press platform.
Data correspond to usage on the plateform after 2015. The current usage metrics is available 48-96 hours after online publication and is updated daily on week days.
Initial download of the metrics may take a while.