Free Access
Fig. 3.
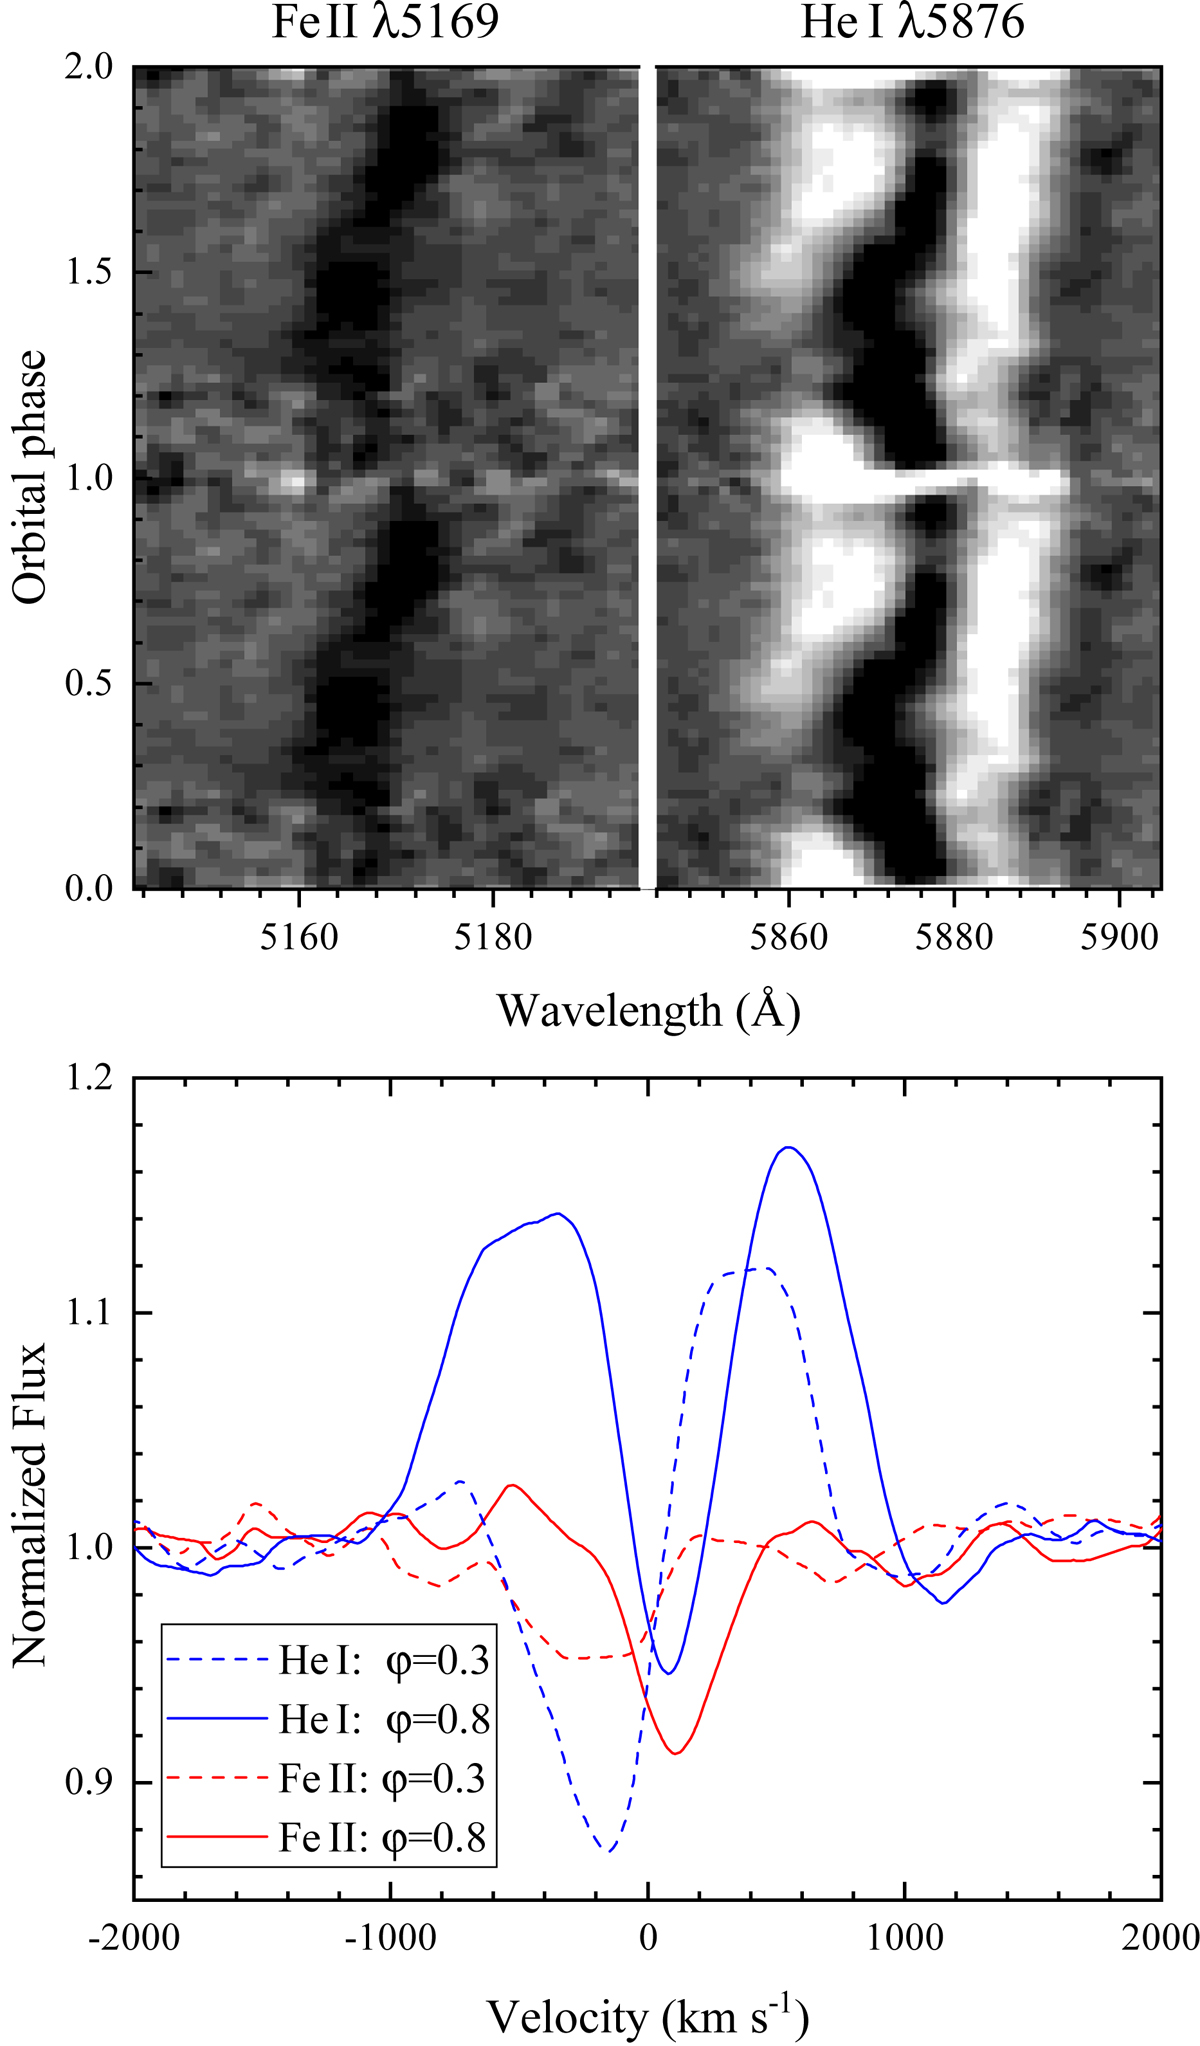
Trailed spectra (top panel) and averaged profiles (bottom panel) of the Fe II 5169 and He I 5876 lines. The spectra are averaged around the orbital phases 0.3 ± 0.1 and 0.8 ± 0.1. Trailed spectra are shown on a linear scale (white indicates emission).
Current usage metrics show cumulative count of Article Views (full-text article views including HTML views, PDF and ePub downloads, according to the available data) and Abstracts Views on Vision4Press platform.
Data correspond to usage on the plateform after 2015. The current usage metrics is available 48-96 hours after online publication and is updated daily on week days.
Initial download of the metrics may take a while.