Fig. 12.
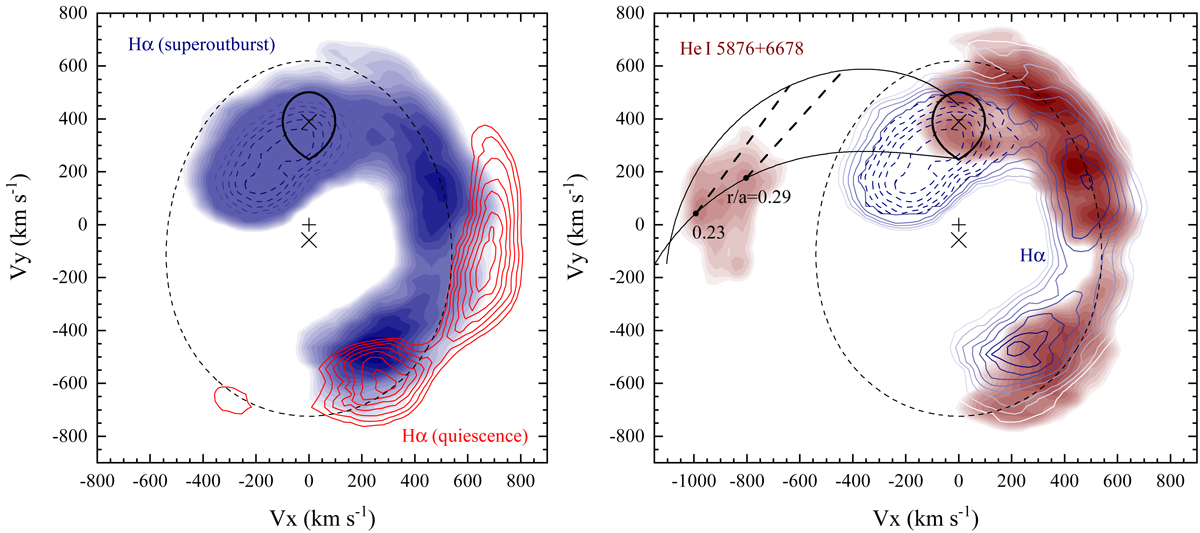
Doppler maps combined from the tomograms for the Hα line in superoutburst and quiescence (left) and for Hα and the He I lines in superoutburst (right). The maps are shown on a linear scale. Different colours represent different lines (red and navy show Hα in quiescence and in superoutburst, respectively, and dark red shows the He I lines in superoutburst). The EEC, the brightest emission component in Hα in superoutburst, is flattened to show other emission structures in more detail. The quasi-elliptical dashed lines represent velocities at the tidal truncation limit.
Current usage metrics show cumulative count of Article Views (full-text article views including HTML views, PDF and ePub downloads, according to the available data) and Abstracts Views on Vision4Press platform.
Data correspond to usage on the plateform after 2015. The current usage metrics is available 48-96 hours after online publication and is updated daily on week days.
Initial download of the metrics may take a while.