Fig. 11.
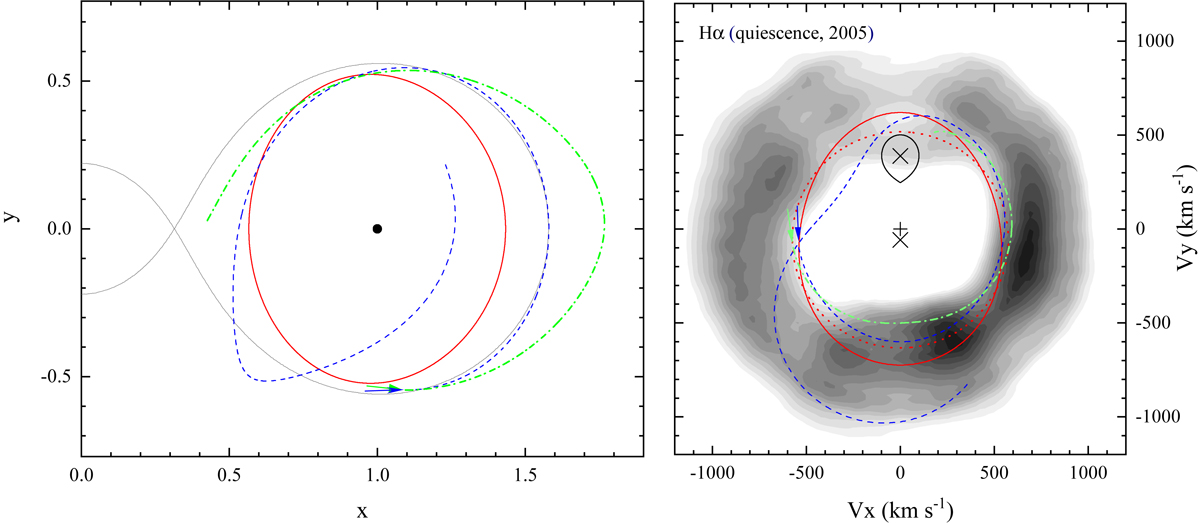
Truncated orbit (solid red line), and two non-periodic trajectories (dashed blue and dash-dotted green lines) in the restricted three-body problem calculated for a binary with q = 0.15, shown in spatial (left) and velocity coordinates over the Hα Doppler map from the 2005 observations in quiescence (right). The Doppler map is shown on a linear scale. The dotted red line on the map represents circular Keplerian velocities at rmax.
Current usage metrics show cumulative count of Article Views (full-text article views including HTML views, PDF and ePub downloads, according to the available data) and Abstracts Views on Vision4Press platform.
Data correspond to usage on the plateform after 2015. The current usage metrics is available 48-96 hours after online publication and is updated daily on week days.
Initial download of the metrics may take a while.