Fig. 12.
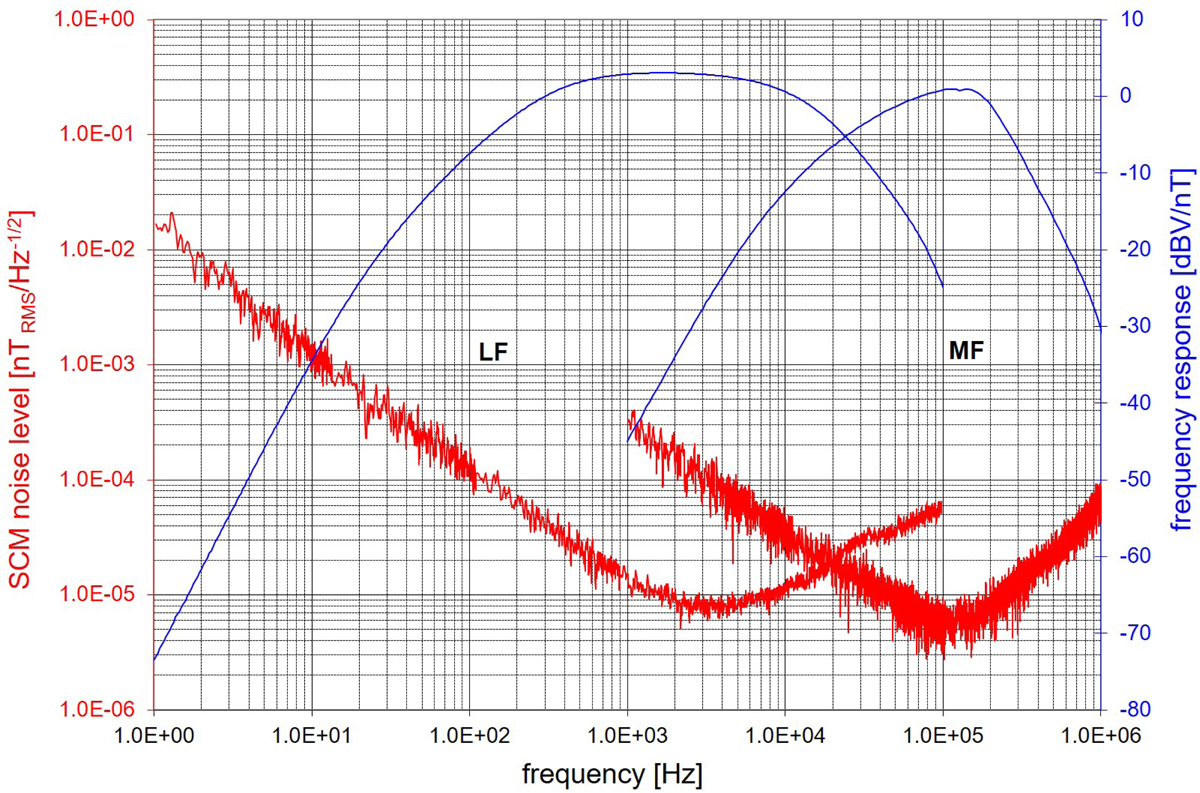
Measured equivalent magnetic noise level (in red) and frequency response (in blue) of SCM flight model. The curves on the left are for LF antennas and the curves on the right for the MF one. The blue curves represent actually the sensors gains as a function of the frequency.
Current usage metrics show cumulative count of Article Views (full-text article views including HTML views, PDF and ePub downloads, according to the available data) and Abstracts Views on Vision4Press platform.
Data correspond to usage on the plateform after 2015. The current usage metrics is available 48-96 hours after online publication and is updated daily on week days.
Initial download of the metrics may take a while.