Fig. 38.
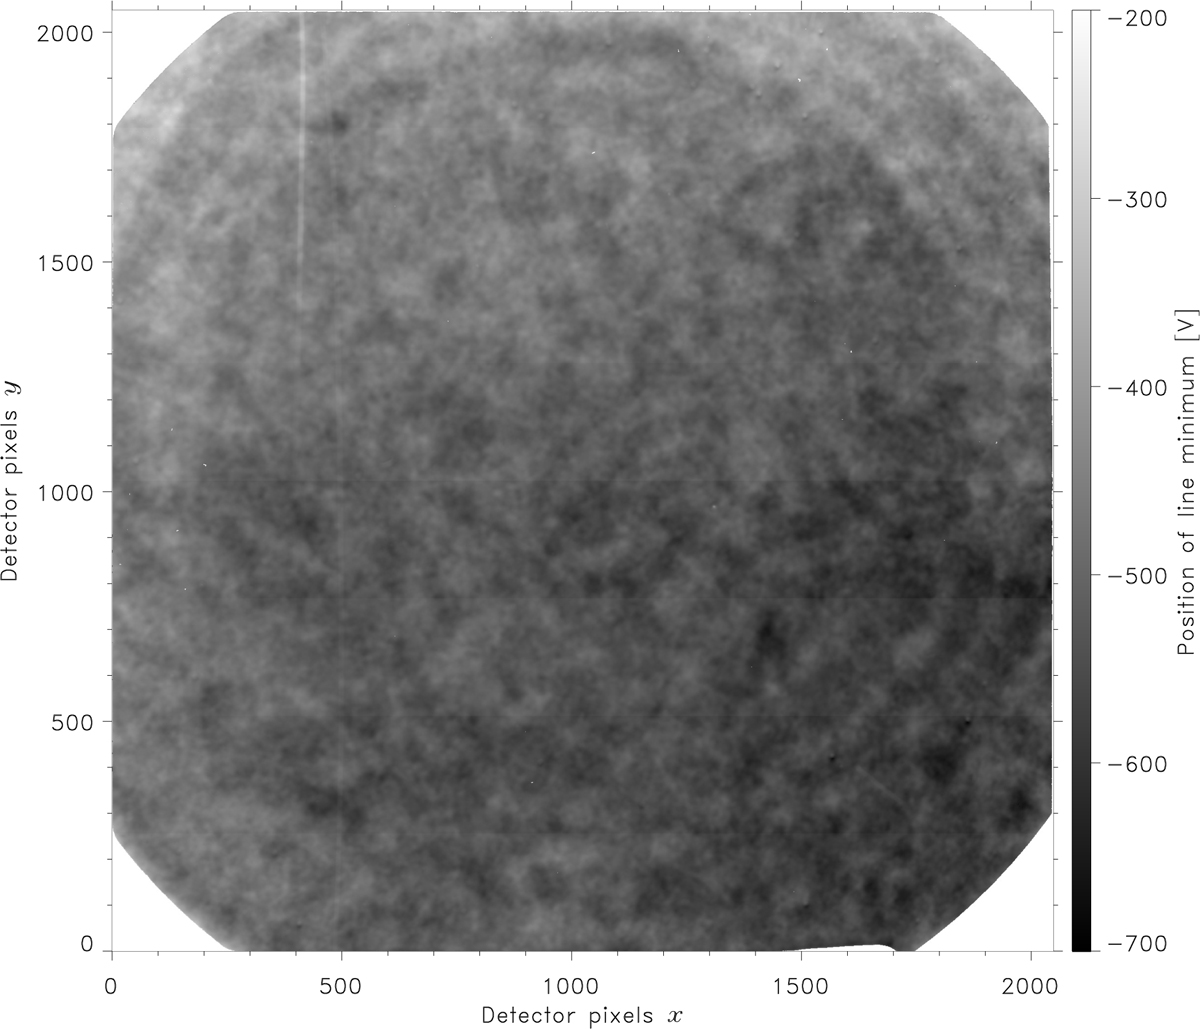
Etalon cavity map obtained from Gaussian fits to the centre of the Fe I 6173 Å spectral line during HRT ground calibration. The large-scale trend and the slight shift of the two scans shown in Fig. 37 arise from the solar rotation pattern imprinted in the incoming light, since the HRT FOV covers almost the entire solar disc at 1 AU distance, even if the feed optics does not provide a focused solar image.
Current usage metrics show cumulative count of Article Views (full-text article views including HTML views, PDF and ePub downloads, according to the available data) and Abstracts Views on Vision4Press platform.
Data correspond to usage on the plateform after 2015. The current usage metrics is available 48-96 hours after online publication and is updated daily on week days.
Initial download of the metrics may take a while.