Open Access
Fig. 37.
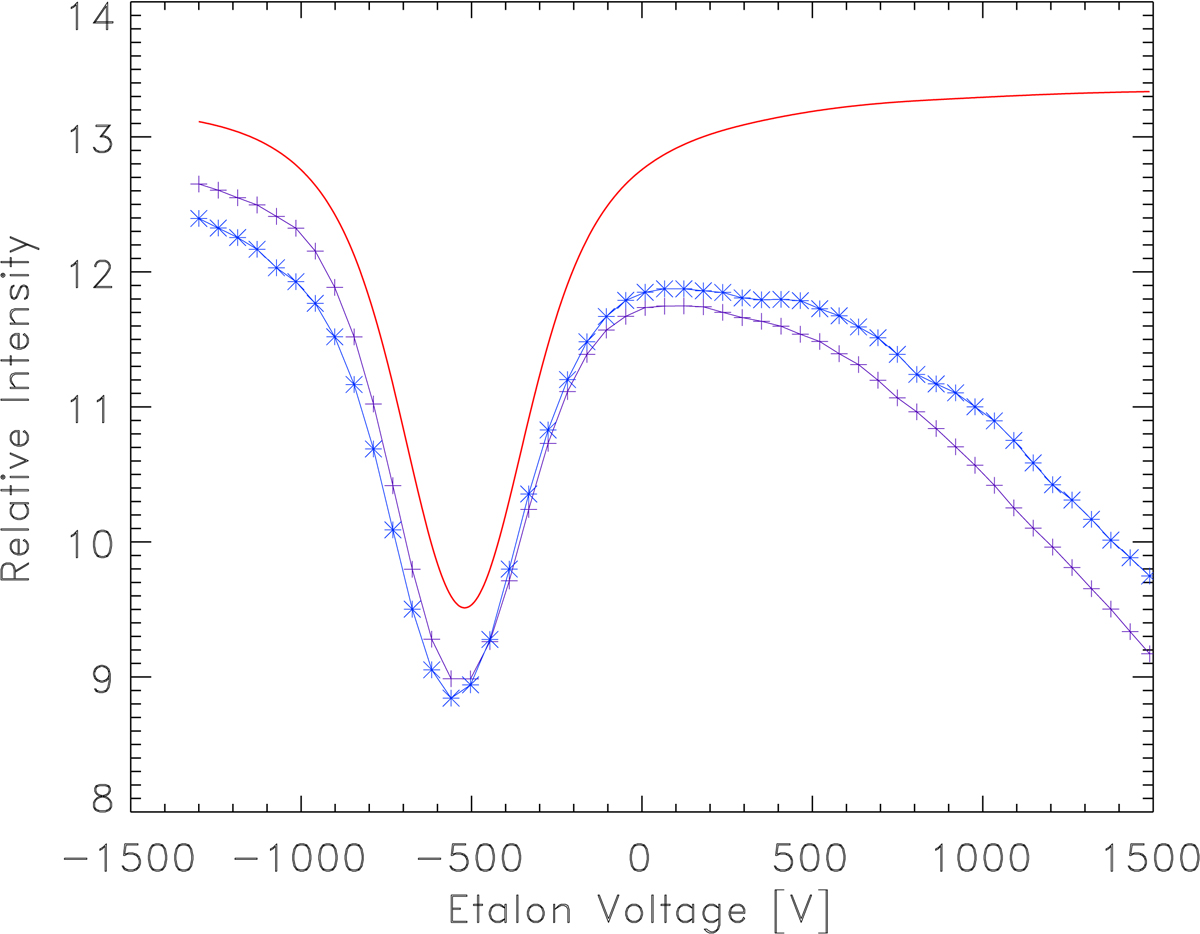
Spectral scans across the Fe I 6173 Å spectral line (crosses and asterisks) obtained from different sectors of the science detector during HRT ground calibration. The solid line denotes a convolution of the FTS spectrum with an Airy function of 106 mÅ FWHM.
Current usage metrics show cumulative count of Article Views (full-text article views including HTML views, PDF and ePub downloads, according to the available data) and Abstracts Views on Vision4Press platform.
Data correspond to usage on the plateform after 2015. The current usage metrics is available 48-96 hours after online publication and is updated daily on week days.
Initial download of the metrics may take a while.