Fig. 14.
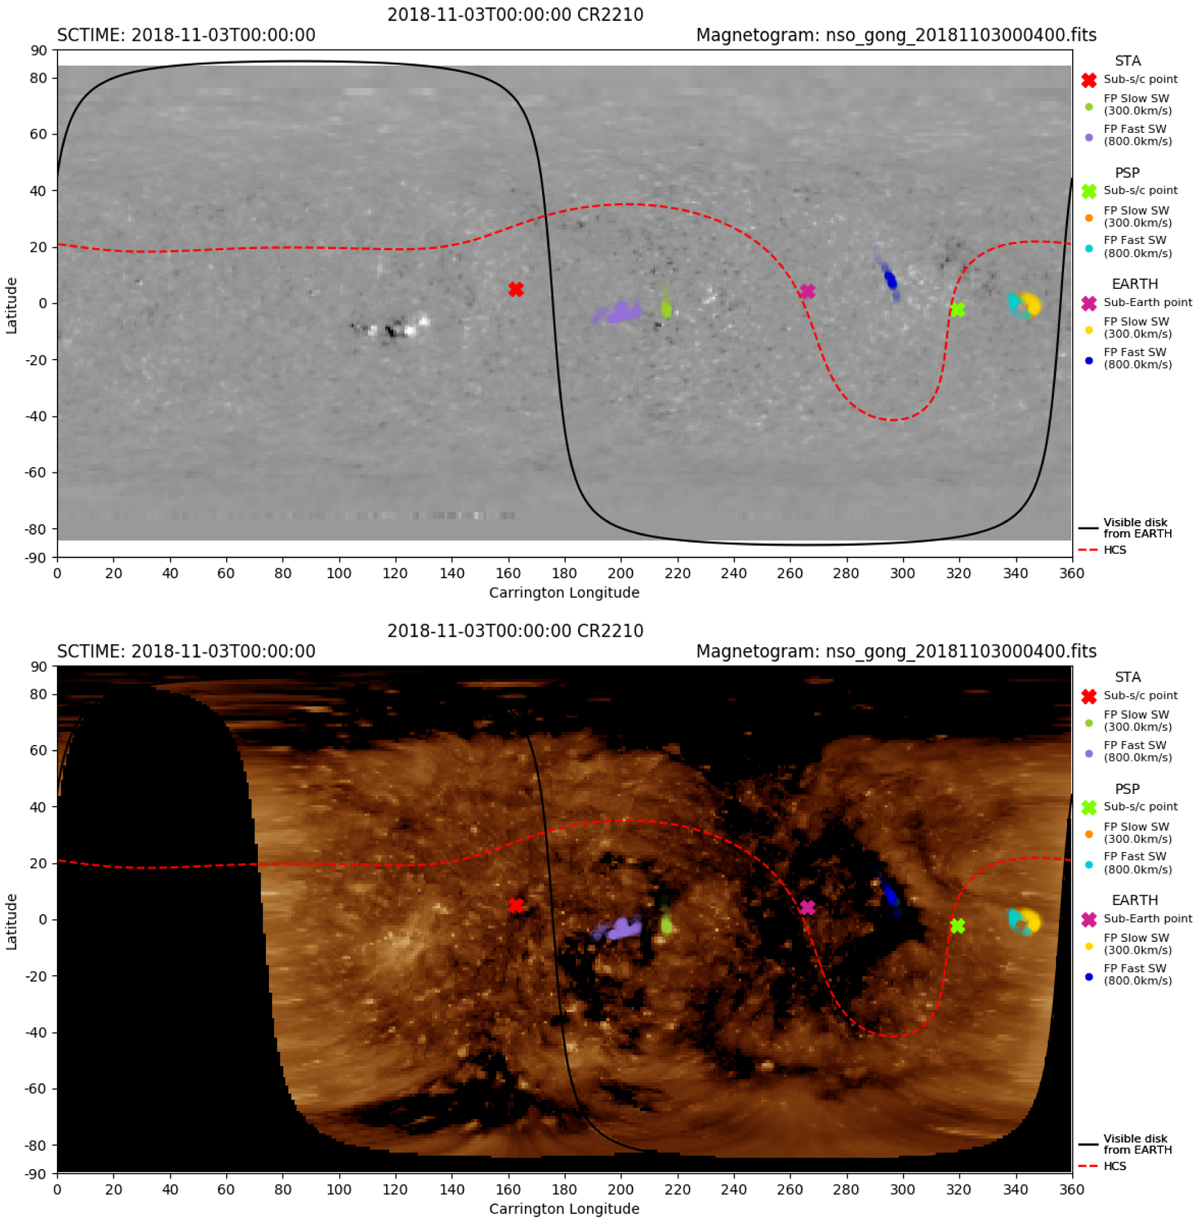
Connectivity maps produced by the connectivity tool in science mode (for past data) overlayed on a NSO/GONG mangetogram, and on a combined SDO/AIA and STEREO-A/EUVI 193 Å Carrington maps. The symbols have the same meaning as those in Fig. 13, but here we have used the wind speeds measured in situ at L1 and by STEREO-A. Uncertainties intrinsic to the coronal and heliospheric models used are still maintained, giving rise to the corresponding clouds of points in the map.
Current usage metrics show cumulative count of Article Views (full-text article views including HTML views, PDF and ePub downloads, according to the available data) and Abstracts Views on Vision4Press platform.
Data correspond to usage on the plateform after 2015. The current usage metrics is available 48-96 hours after online publication and is updated daily on week days.
Initial download of the metrics may take a while.