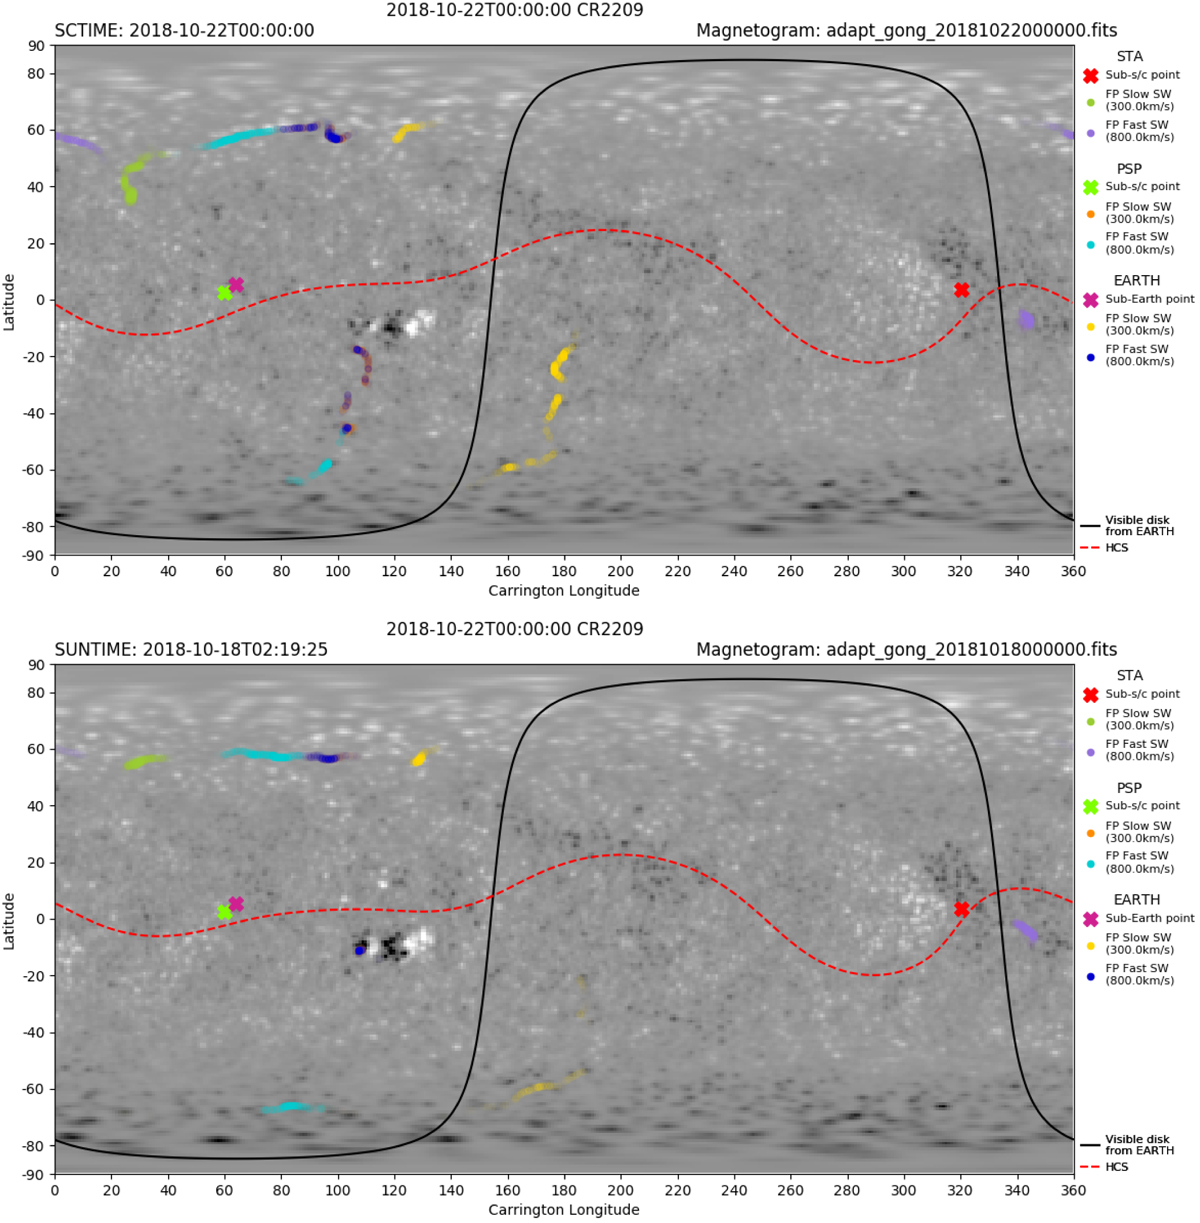
Fig. 13.

Examples of connectivity maps forecasted 2 days in advance by the connectivity tool using ADAPT/GONG magnetic field maps a simple heuristic estimate for the speed of the wind stream reaching the S/C (PSP on this example). Zones of high connectivity probability are shown for PSP, Earth and STEREO-A, for assumed slow and fast solar winds. Top panel: instantaneous magnetic connectivity at the time considered, bottom panel: connectivity footpoints at the time of the expected solar wind plasma release, highlighting the subtle differences between both. These maps clearly show how proximity to strong topological features such as large equatorial streamers and the HCS can affect the estimations of connectivity (sometimes more severely during solar minima), resulting in this case in wide latitudinal separations (cf. points of the same colour both on the northern and southern hemispheres). Solar Orbiter LLD data will be fundamental to help establishing the most likely source of plasma in these situations.
Current usage metrics show cumulative count of Article Views (full-text article views including HTML views, PDF and ePub downloads, according to the available data) and Abstracts Views on Vision4Press platform.
Data correspond to usage on the plateform after 2015. The current usage metrics is available 48-96 hours after online publication and is updated daily on week days.
Initial download of the metrics may take a while.


