Fig. 1.
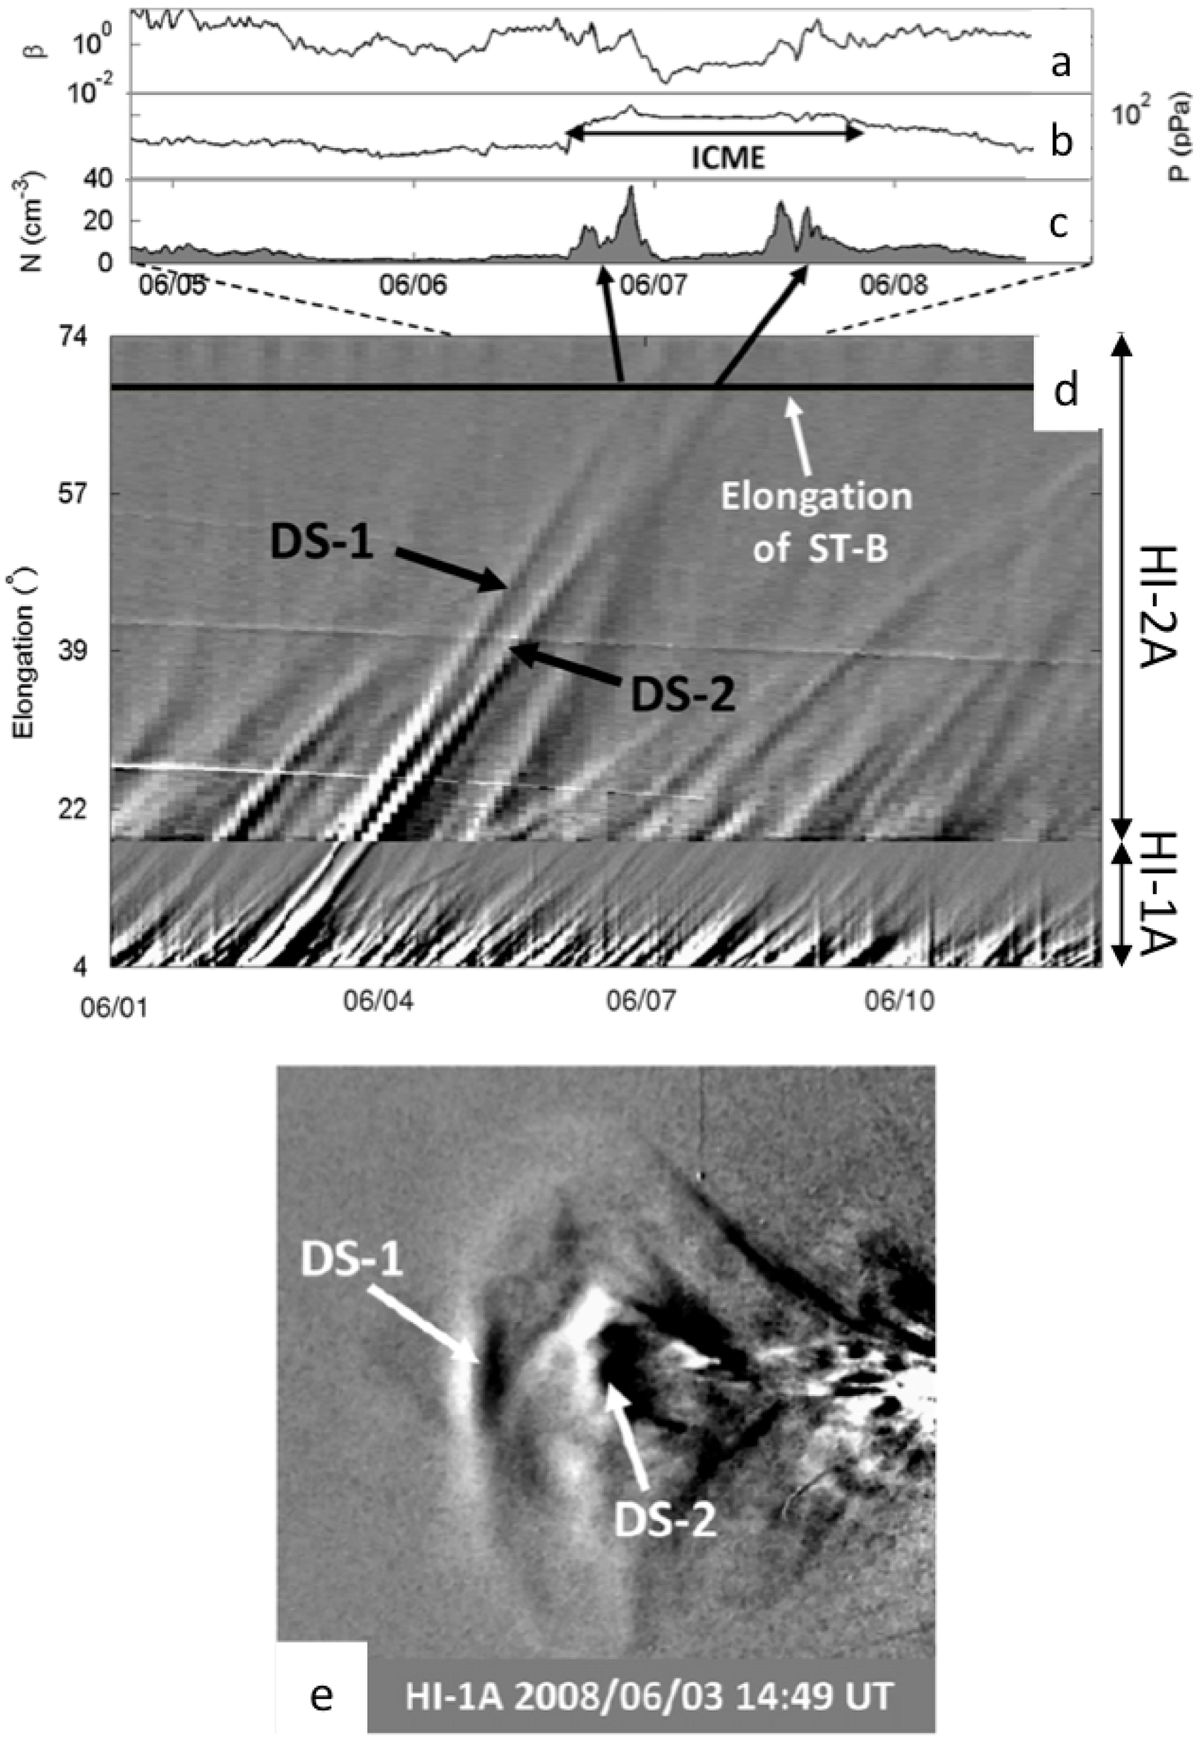
Illustration of a successful linkage between a CME observed in white-light on STEREO-A on 3 June 2008 (panel e) with subsequent in situ signature at STEREO-B on 7 June 2008: the top panels show (a) plasma beta, (b) total plasma pressure, (c) number density from 2 to 7 June 2008 measured at STEREO-B. Middle: STEREO-A elongation-time J-map combining HI-1 and HI-2 running difference images. The vertical dotted lines mark the extent of the ICME signature in the STEREO-B data. The ICME boundaries closely match the region bounded by the leading and trailing elongation-time tracks in the STEREO-A data (black arrows). Bottom panel: one of the HI-1A running-difference images employed to build the J-map. From Rouillard (2011). Reprinted by permission of JASTP.
Current usage metrics show cumulative count of Article Views (full-text article views including HTML views, PDF and ePub downloads, according to the available data) and Abstracts Views on Vision4Press platform.
Data correspond to usage on the plateform after 2015. The current usage metrics is available 48-96 hours after online publication and is updated daily on week days.
Initial download of the metrics may take a while.