Fig. 4.
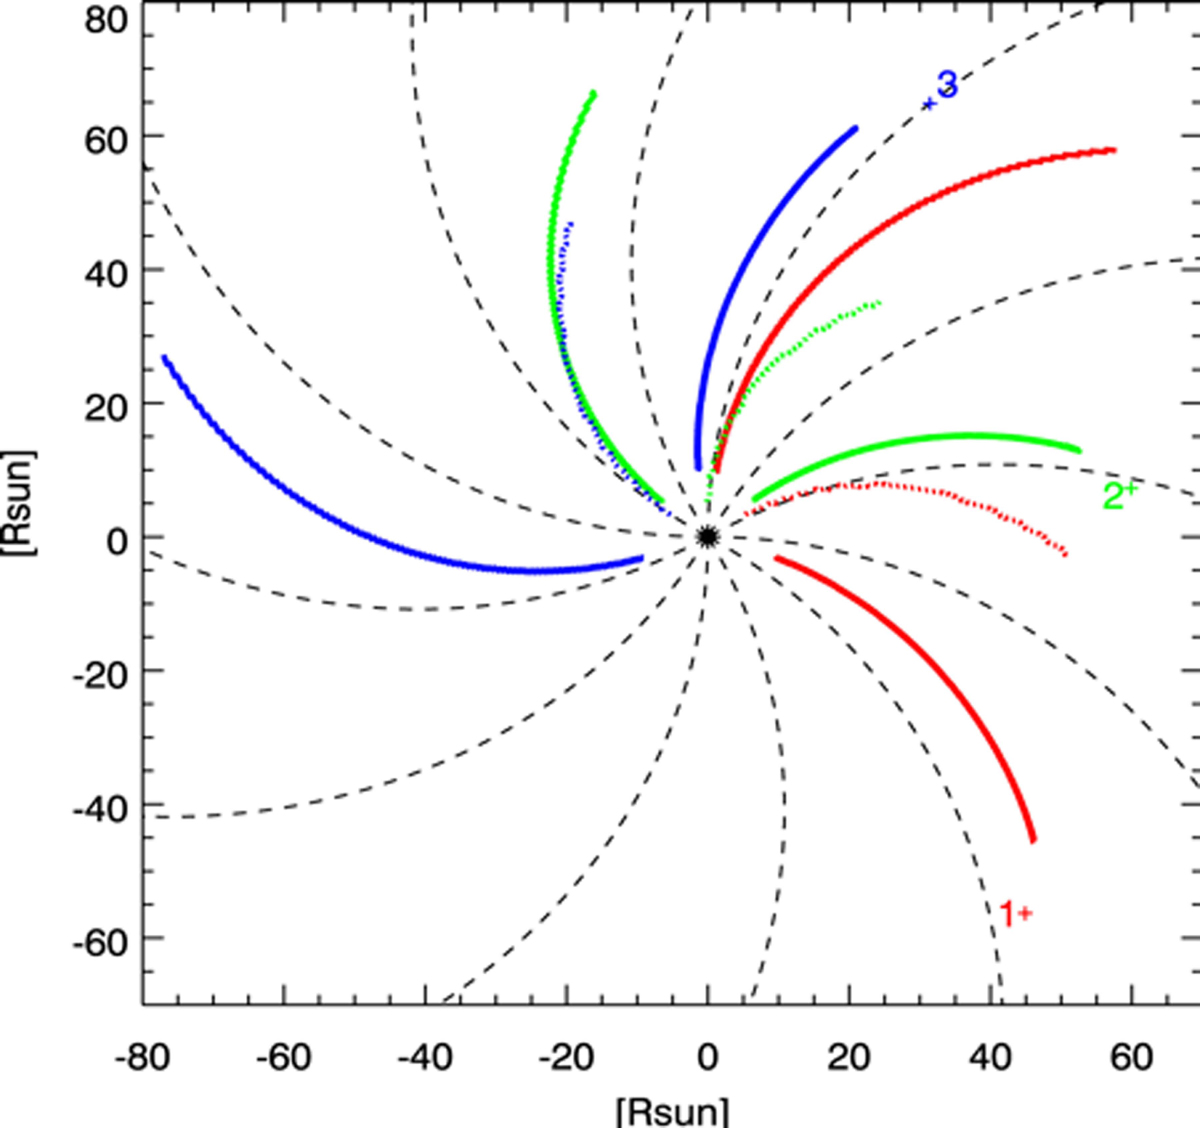
Sensitivity map of the Thomson scattering emission for the Solar Orbiter–Sun geometries at perihelion. Each number signifies the location in the orbit identified by the + (“2” is perihelion of 0.28 AU, while “1” and “3” are both at 0.34 AU). The three differently coloured arcs mark the loci of three percentages of the total brightness integration along the LOS. The solid line closest to the location gives the loci at 5% of the total integral, the dotted line gives 50% and the solid line farthest from the location gives 95%. The extents of the arcs mark the SoloHI FOV. The black dotted lines show the direction of the Parker Spiral for a 300 km s−1 wind.
Current usage metrics show cumulative count of Article Views (full-text article views including HTML views, PDF and ePub downloads, according to the available data) and Abstracts Views on Vision4Press platform.
Data correspond to usage on the plateform after 2015. The current usage metrics is available 48-96 hours after online publication and is updated daily on week days.
Initial download of the metrics may take a while.