Fig. 21.
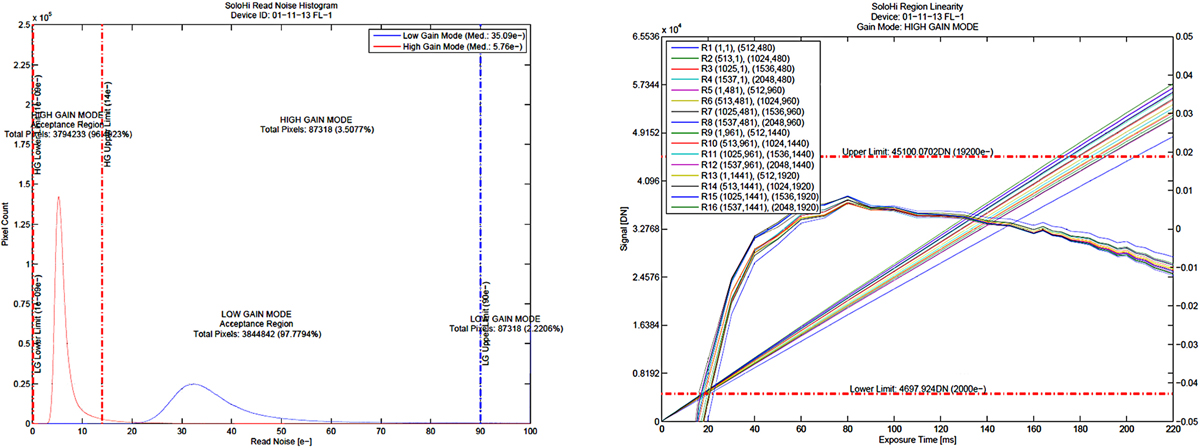
Left: read noise performance. The low-gain mode histogram plot is in blue and the high-gain histogram plot is in red. The requirements for the two modes is shown in the vertical dashed lines of the corresponding colours. The median value of the high-gain noise is 5.8 electrons and the low gain is 35.1 electrons. Right: linearity response in high gain. The linearity was computed within 16 regions. Each region is plotted as the total signal (left axis) vs. the exposure time and the difference from a linear fit expressed as a ratio to the total signal (right axis). The horizontal dashed lines give the lower and upper limits of the ratio requirements.
Current usage metrics show cumulative count of Article Views (full-text article views including HTML views, PDF and ePub downloads, according to the available data) and Abstracts Views on Vision4Press platform.
Data correspond to usage on the plateform after 2015. The current usage metrics is available 48-96 hours after online publication and is updated daily on week days.
Initial download of the metrics may take a while.