Fig. 7
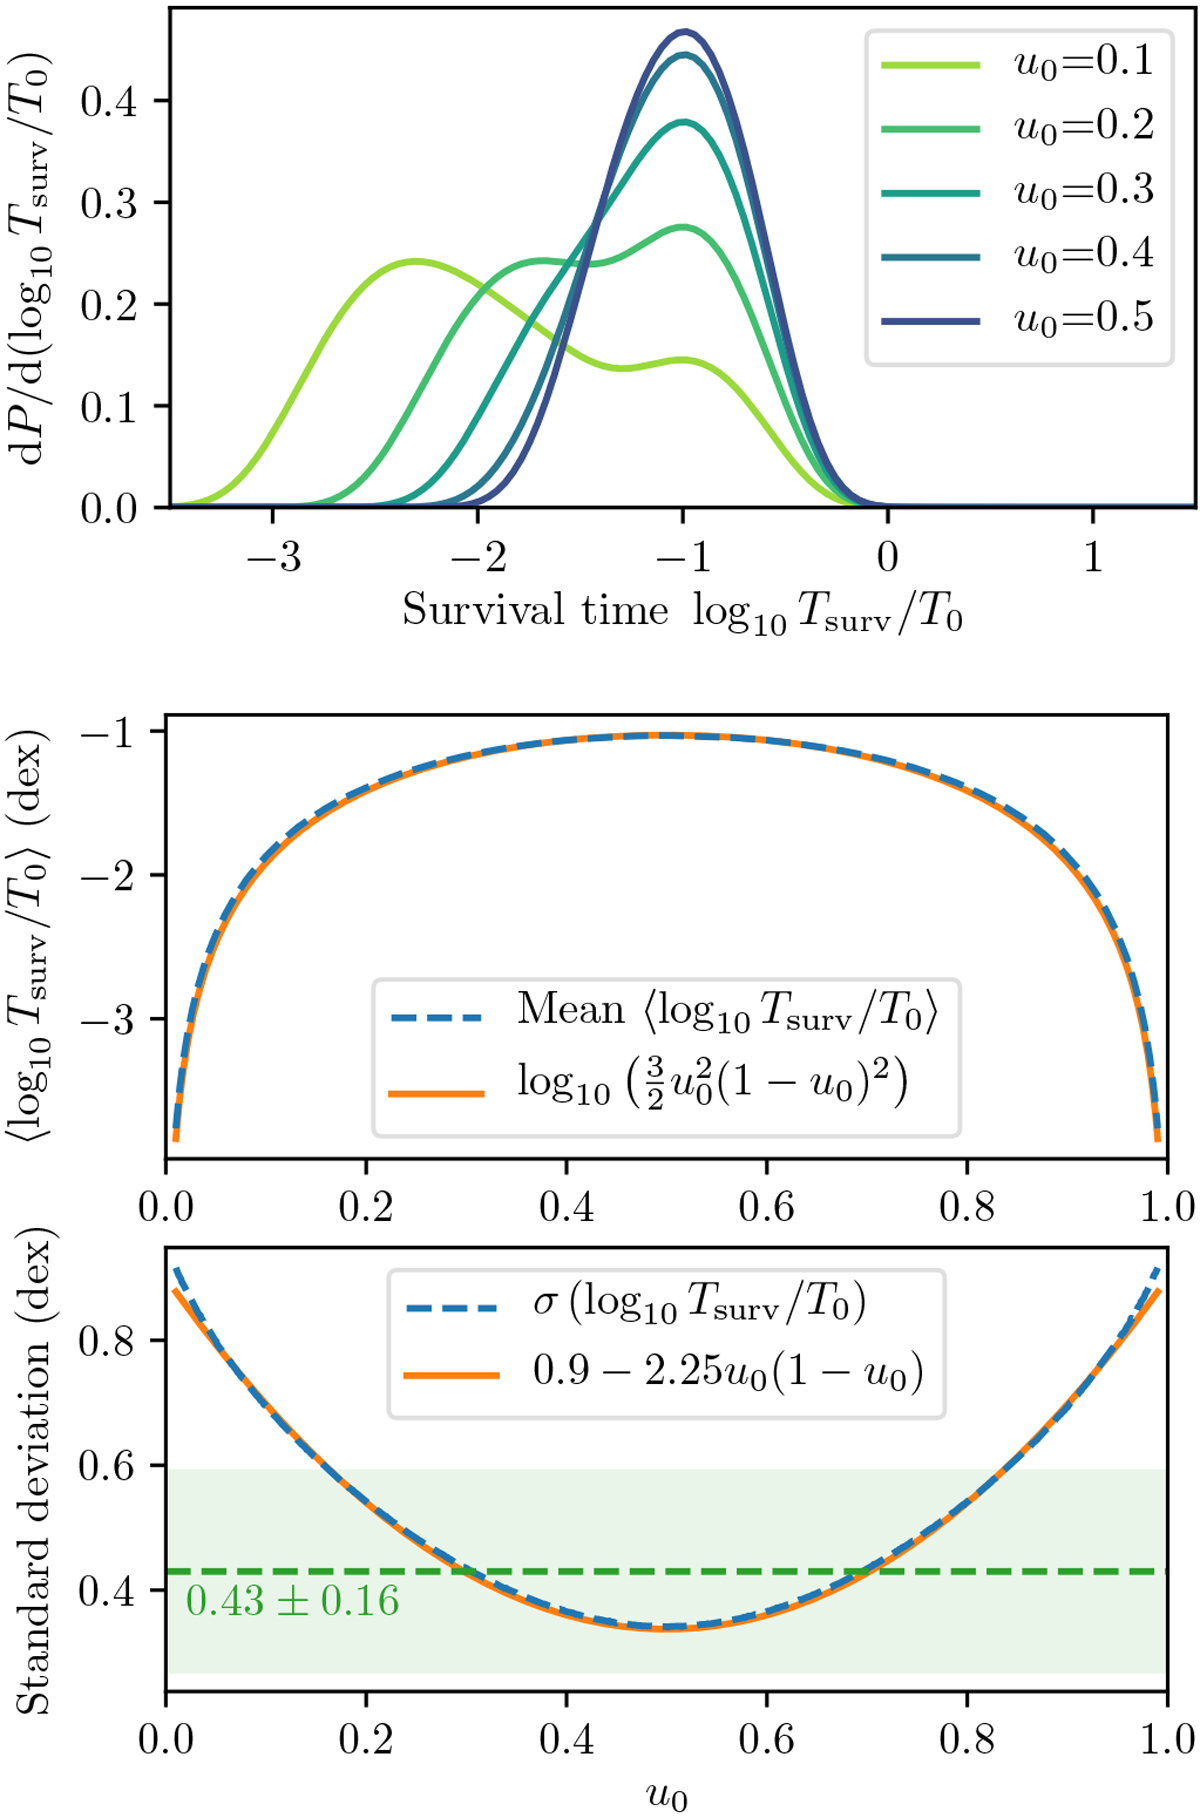
Top panel: probability distribution function of log10Tsurv∕T0 for various values of u0, the normalised distance of the initial condition of the system to the two neighbouring first-order two-planet MMRs. We see that for u0 = 0.5, the time distribution is log-normal as observed in Hussain & Tamayo (2020). Bottom panels: mean and standard deviation of the distribution as a function of u0. We also plotapproximate fits to the curves. We note that the mean remains within an order of magnitude of its maximum for almost all values of u0. For u0 close to 0.5, the standard deviation is close to the value 0.43 ± 0.16 measured byHussain & Tamayo (2020), plotted as a green line with its 1σ error.
Current usage metrics show cumulative count of Article Views (full-text article views including HTML views, PDF and ePub downloads, according to the available data) and Abstracts Views on Vision4Press platform.
Data correspond to usage on the plateform after 2015. The current usage metrics is available 48-96 hours after online publication and is updated daily on week days.
Initial download of the metrics may take a while.