Fig. 2
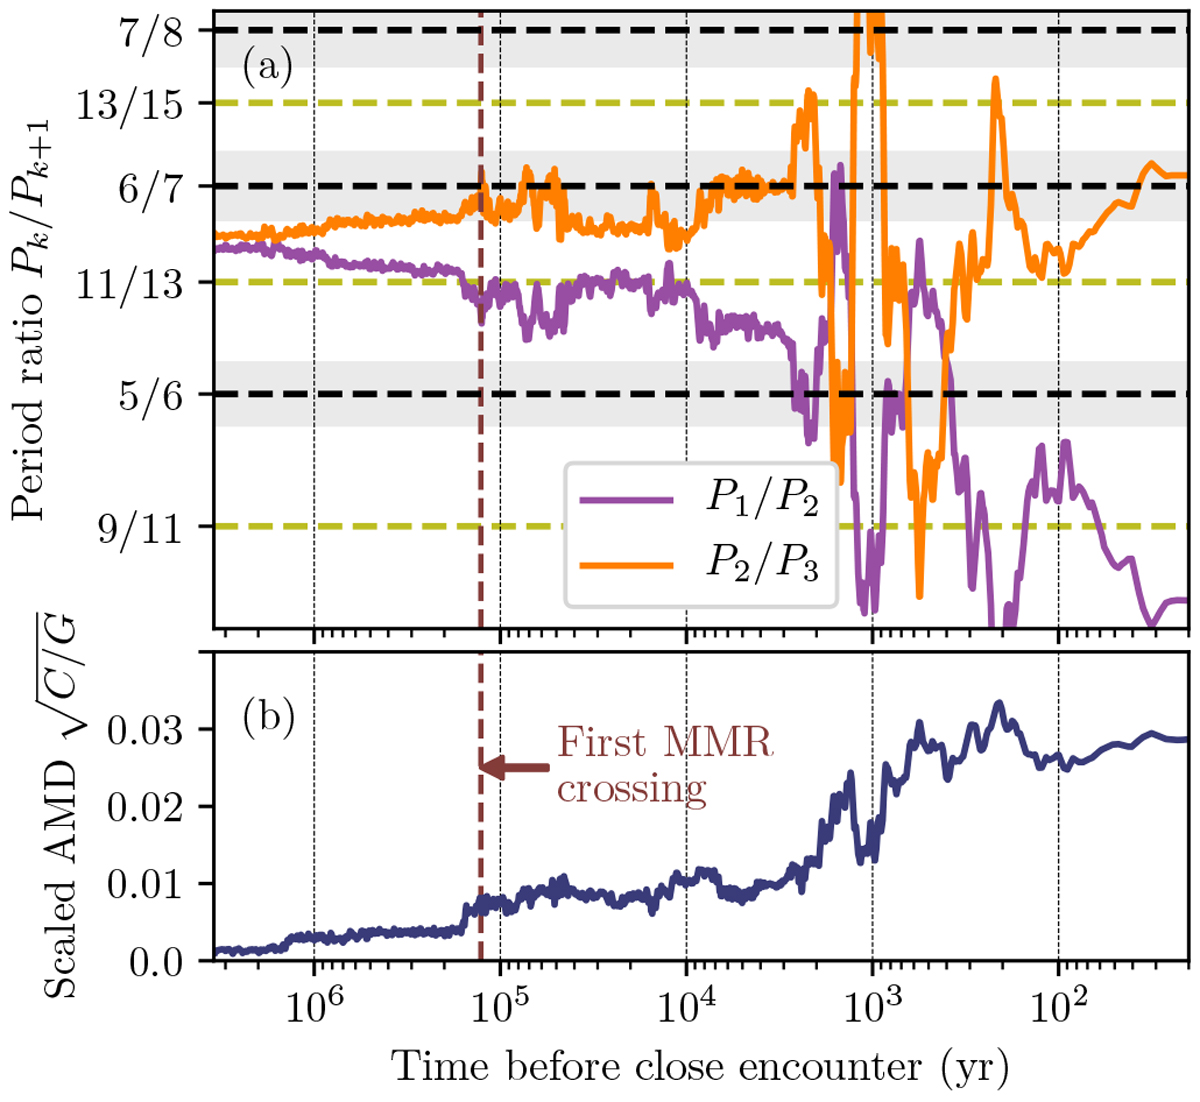
Panel a: period ratio of the adjacent pairs as a function of the time to the close encounter. We note the logarithmic scale. The vertical dashed line is the same as in Fig. 1. The black horizontal dashed lines corresponds to first-order MMRs, the yellow dashed lines to the second-order MMRs. The width of the first-order MMRs is displayed in grey. Panel b: AMD normalised by the total angular momentum as a function of the time to the close encounter. Using the square root gives a typical value of the planet eccentricities.
Current usage metrics show cumulative count of Article Views (full-text article views including HTML views, PDF and ePub downloads, according to the available data) and Abstracts Views on Vision4Press platform.
Data correspond to usage on the plateform after 2015. The current usage metrics is available 48-96 hours after online publication and is updated daily on week days.
Initial download of the metrics may take a while.