Fig. 12
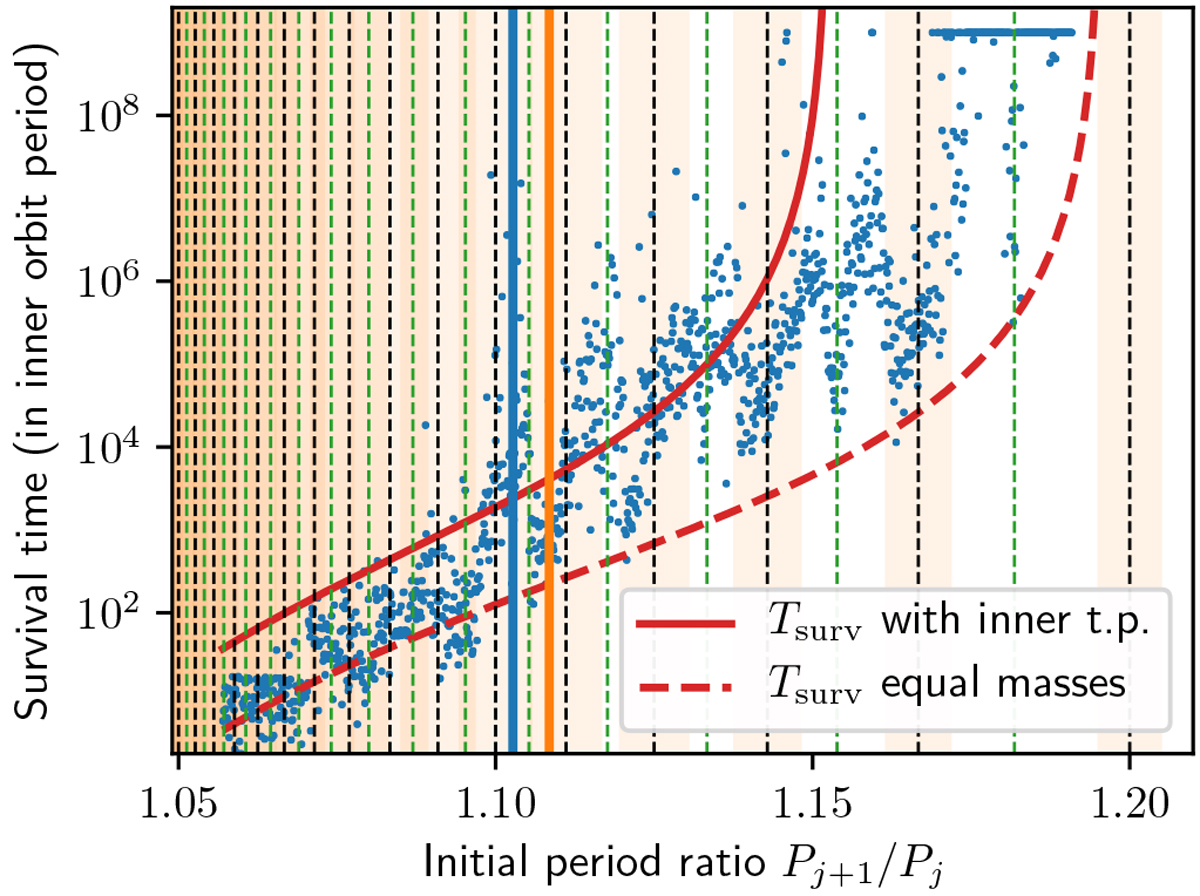
Survival time for a system composed of an inner test particle and two planets of equal mass (10−5 M⊙) with equal spacing as a function of the initial period ratio. See Fig. 8 for a detailed caption. The full red curve is theprediction using the survival time estimate (Eq. (81)) and the dashed line corresponds to the same estimate for the EMS case shown in Fig. 9. The red dotted line corresponds to an alternate estimate position for the limit of the overlapped region (see text and Eq. (84)).
Current usage metrics show cumulative count of Article Views (full-text article views including HTML views, PDF and ePub downloads, according to the available data) and Abstracts Views on Vision4Press platform.
Data correspond to usage on the plateform after 2015. The current usage metrics is available 48-96 hours after online publication and is updated daily on week days.
Initial download of the metrics may take a while.