Fig. 7.
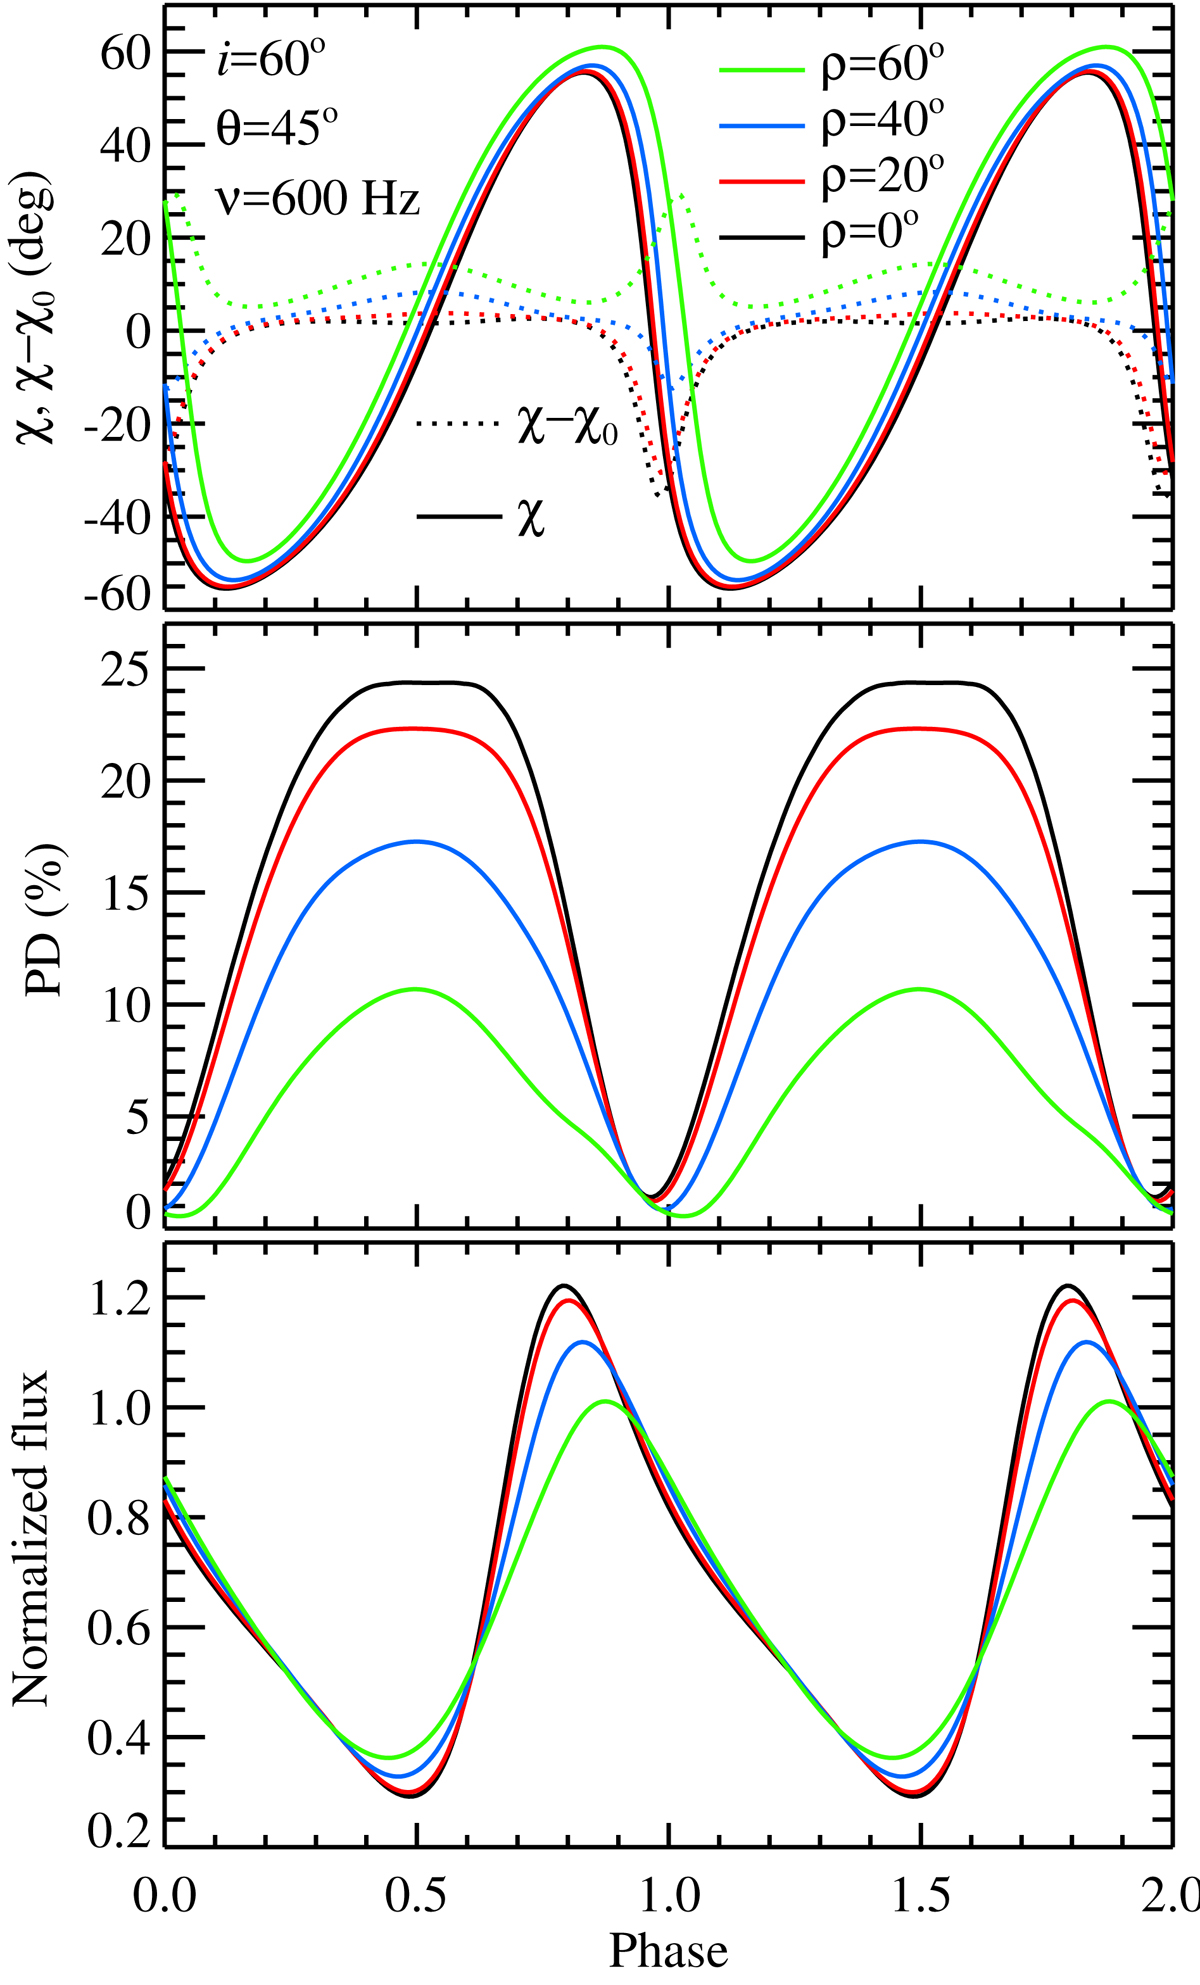
Normalised flux (lower panel), PD (middle panel), and PA (upper panel) as a function of pulsar phase for the fiducial set of parameters for one spot of different sizes. The black, red, blue, and green lines correspond to the spot angular radius ρ = 0°, 20°, 40°, and 60°. The solid lines at the upper panel show the relativistic PA χ, while the dotted lines indicate its difference from the RVM value χ0.
Current usage metrics show cumulative count of Article Views (full-text article views including HTML views, PDF and ePub downloads, according to the available data) and Abstracts Views on Vision4Press platform.
Data correspond to usage on the plateform after 2015. The current usage metrics is available 48-96 hours after online publication and is updated daily on week days.
Initial download of the metrics may take a while.