Fig. 3.
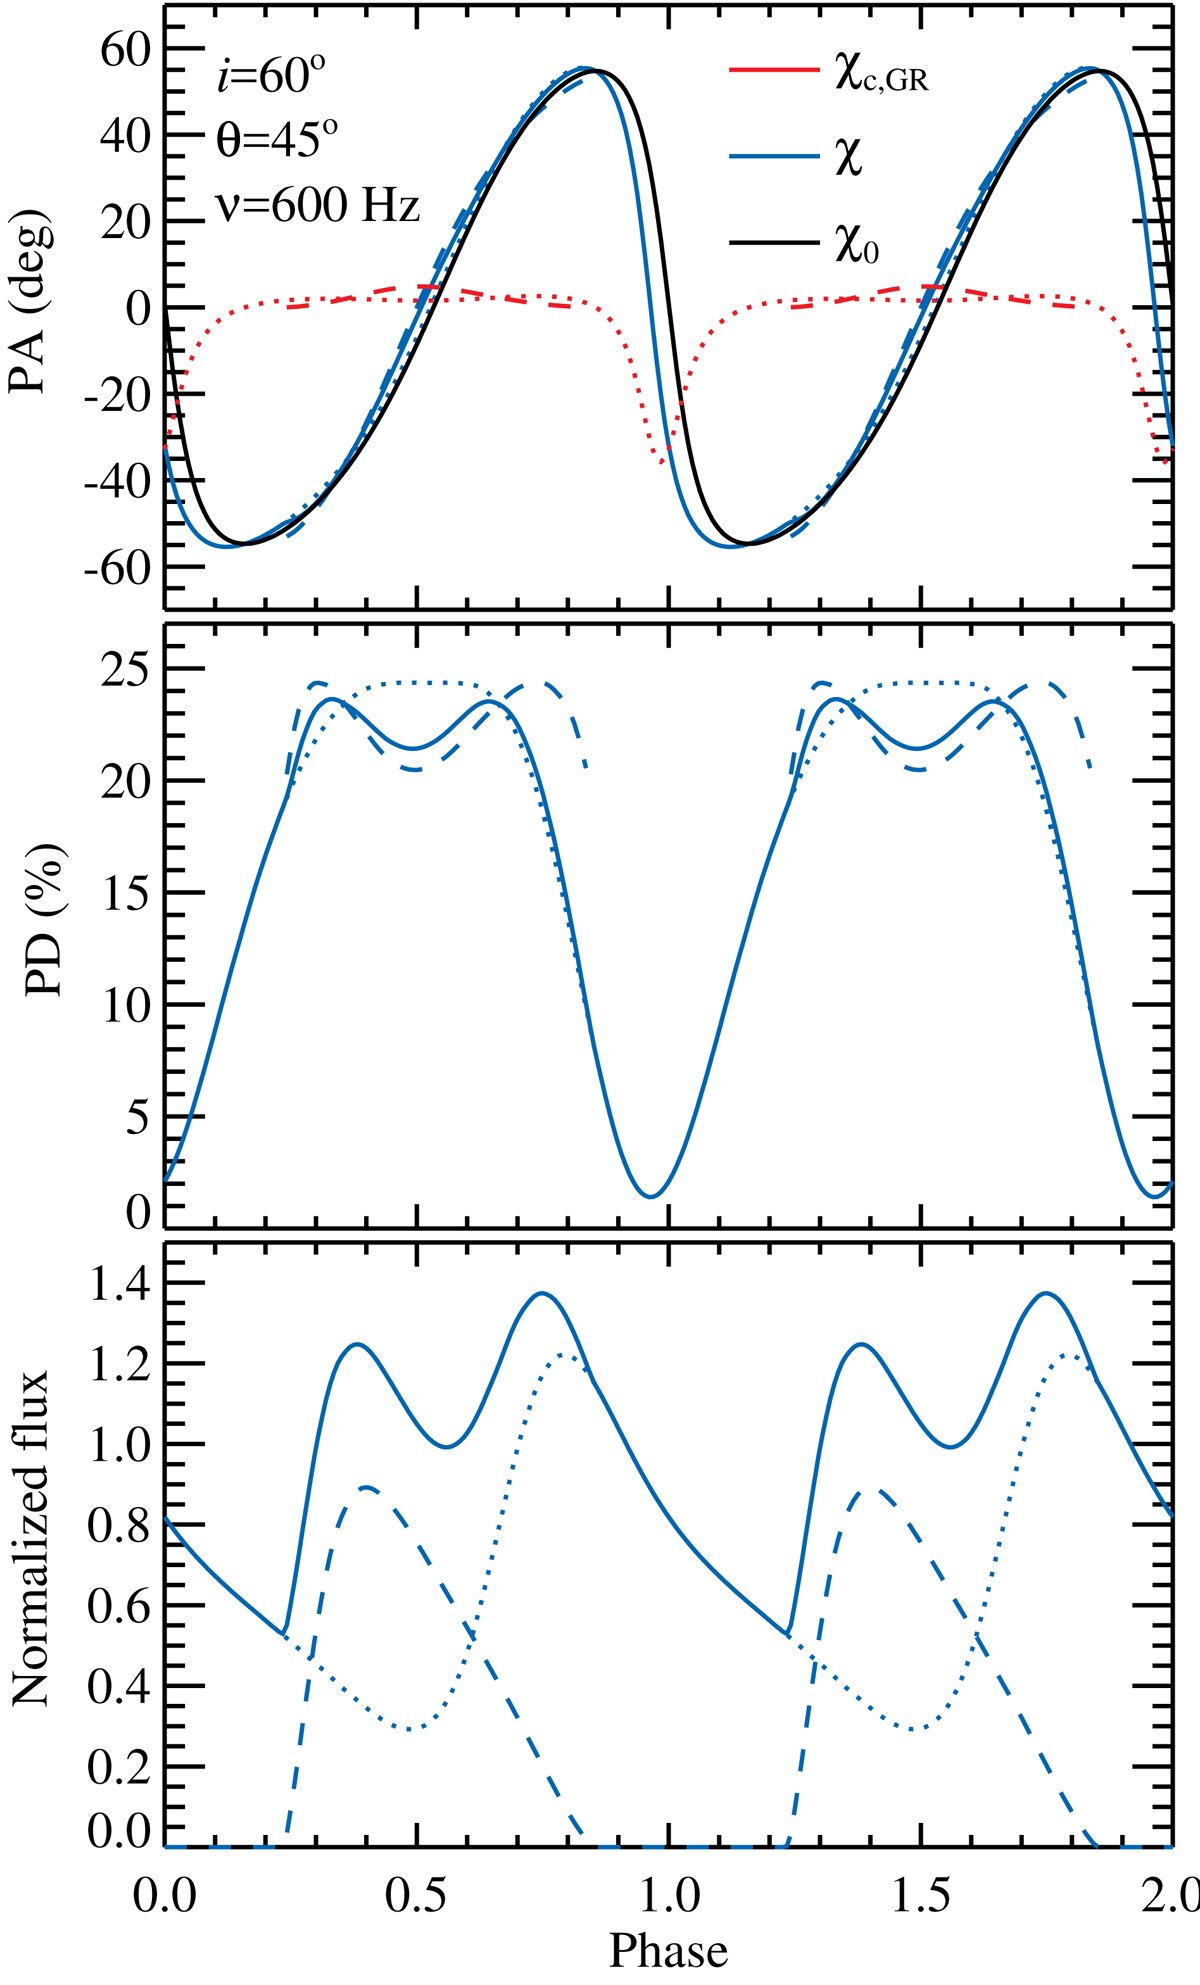
Normalised flux (lower panel), PD (middle panel), and PA (upper panel) as a function of pulsar phase for the fiducial set of parameters M = 1.5 M⊙, R = 12 km, ν = 600 Hz, the inclination i = 60 ° , and the magnetic obliquity is θ = 45°. The dotted lines show the contribution from the primary spot, the dashed lines correspond to the secondary spot, and the solid lines indicate the results for both spots. The PA χ0 from the RVM, as given by Eq. (30) for the primary spot, is shown by the black line. The red lines indicate the GR correction to the PA χc, GR given by Eq. (57) for the two spots. The blue lines show the total PA χ = χ0 + χc, GR for both spots separately and together.
Current usage metrics show cumulative count of Article Views (full-text article views including HTML views, PDF and ePub downloads, according to the available data) and Abstracts Views on Vision4Press platform.
Data correspond to usage on the plateform after 2015. The current usage metrics is available 48-96 hours after online publication and is updated daily on week days.
Initial download of the metrics may take a while.