Fig. 6.
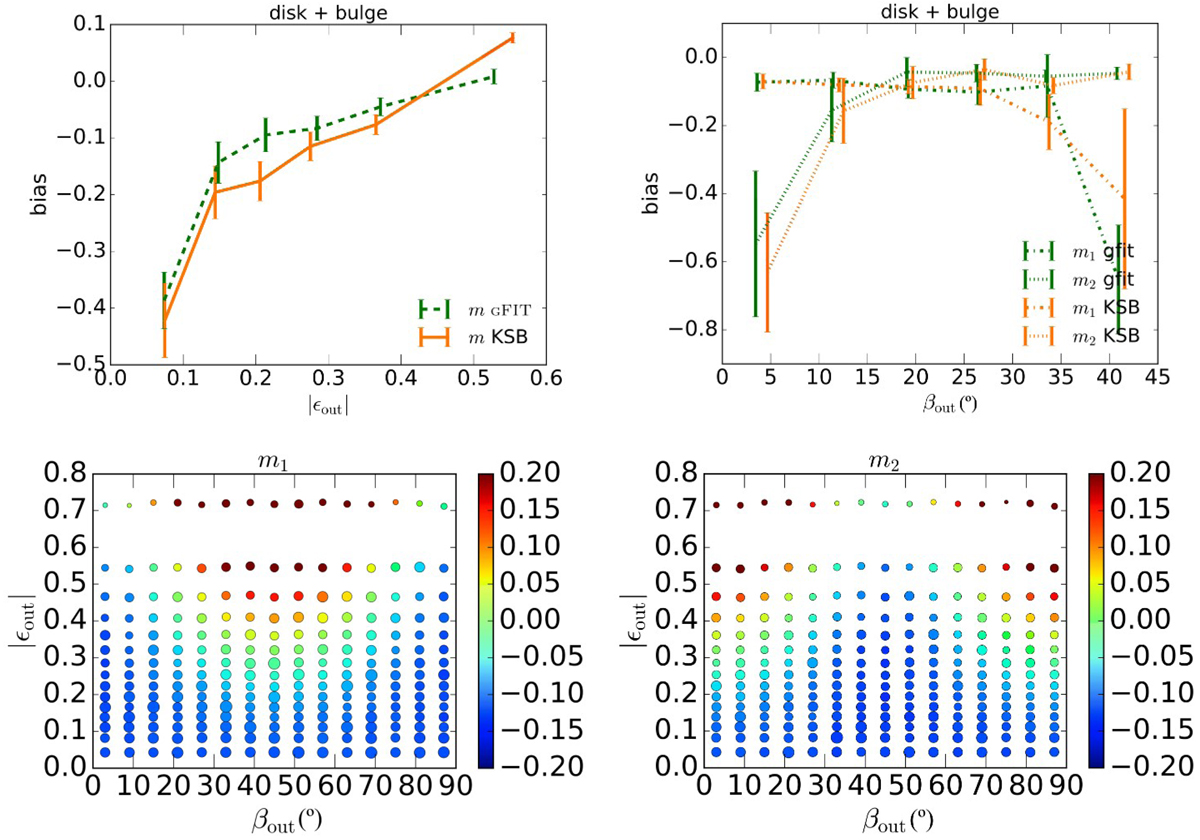
Multiplicative shear bias as a function of the modulus of the observed ellipticity (top left panel) and the observed orientation angle (top right panel) for galaxies with a disc and a bulge. Green lines show the results of m1 (dash-dotted), m2 (dotted), and the mean m (dashed) for GFIT, and orange lines show m1 (dash-dotted), m2 (dotted), and the mean m (solid) for KSB. Bottom panels: m1 (left) and m2 (right) represented by the colour code as a function of observed ellipticity and orientation for galaxies with a single bulge for KSB. The point sizes are inversely proportional to the error on m1, 2 so that large points are more significant.
Current usage metrics show cumulative count of Article Views (full-text article views including HTML views, PDF and ePub downloads, according to the available data) and Abstracts Views on Vision4Press platform.
Data correspond to usage on the plateform after 2015. The current usage metrics is available 48-96 hours after online publication and is updated daily on week days.
Initial download of the metrics may take a while.