Fig. 4.
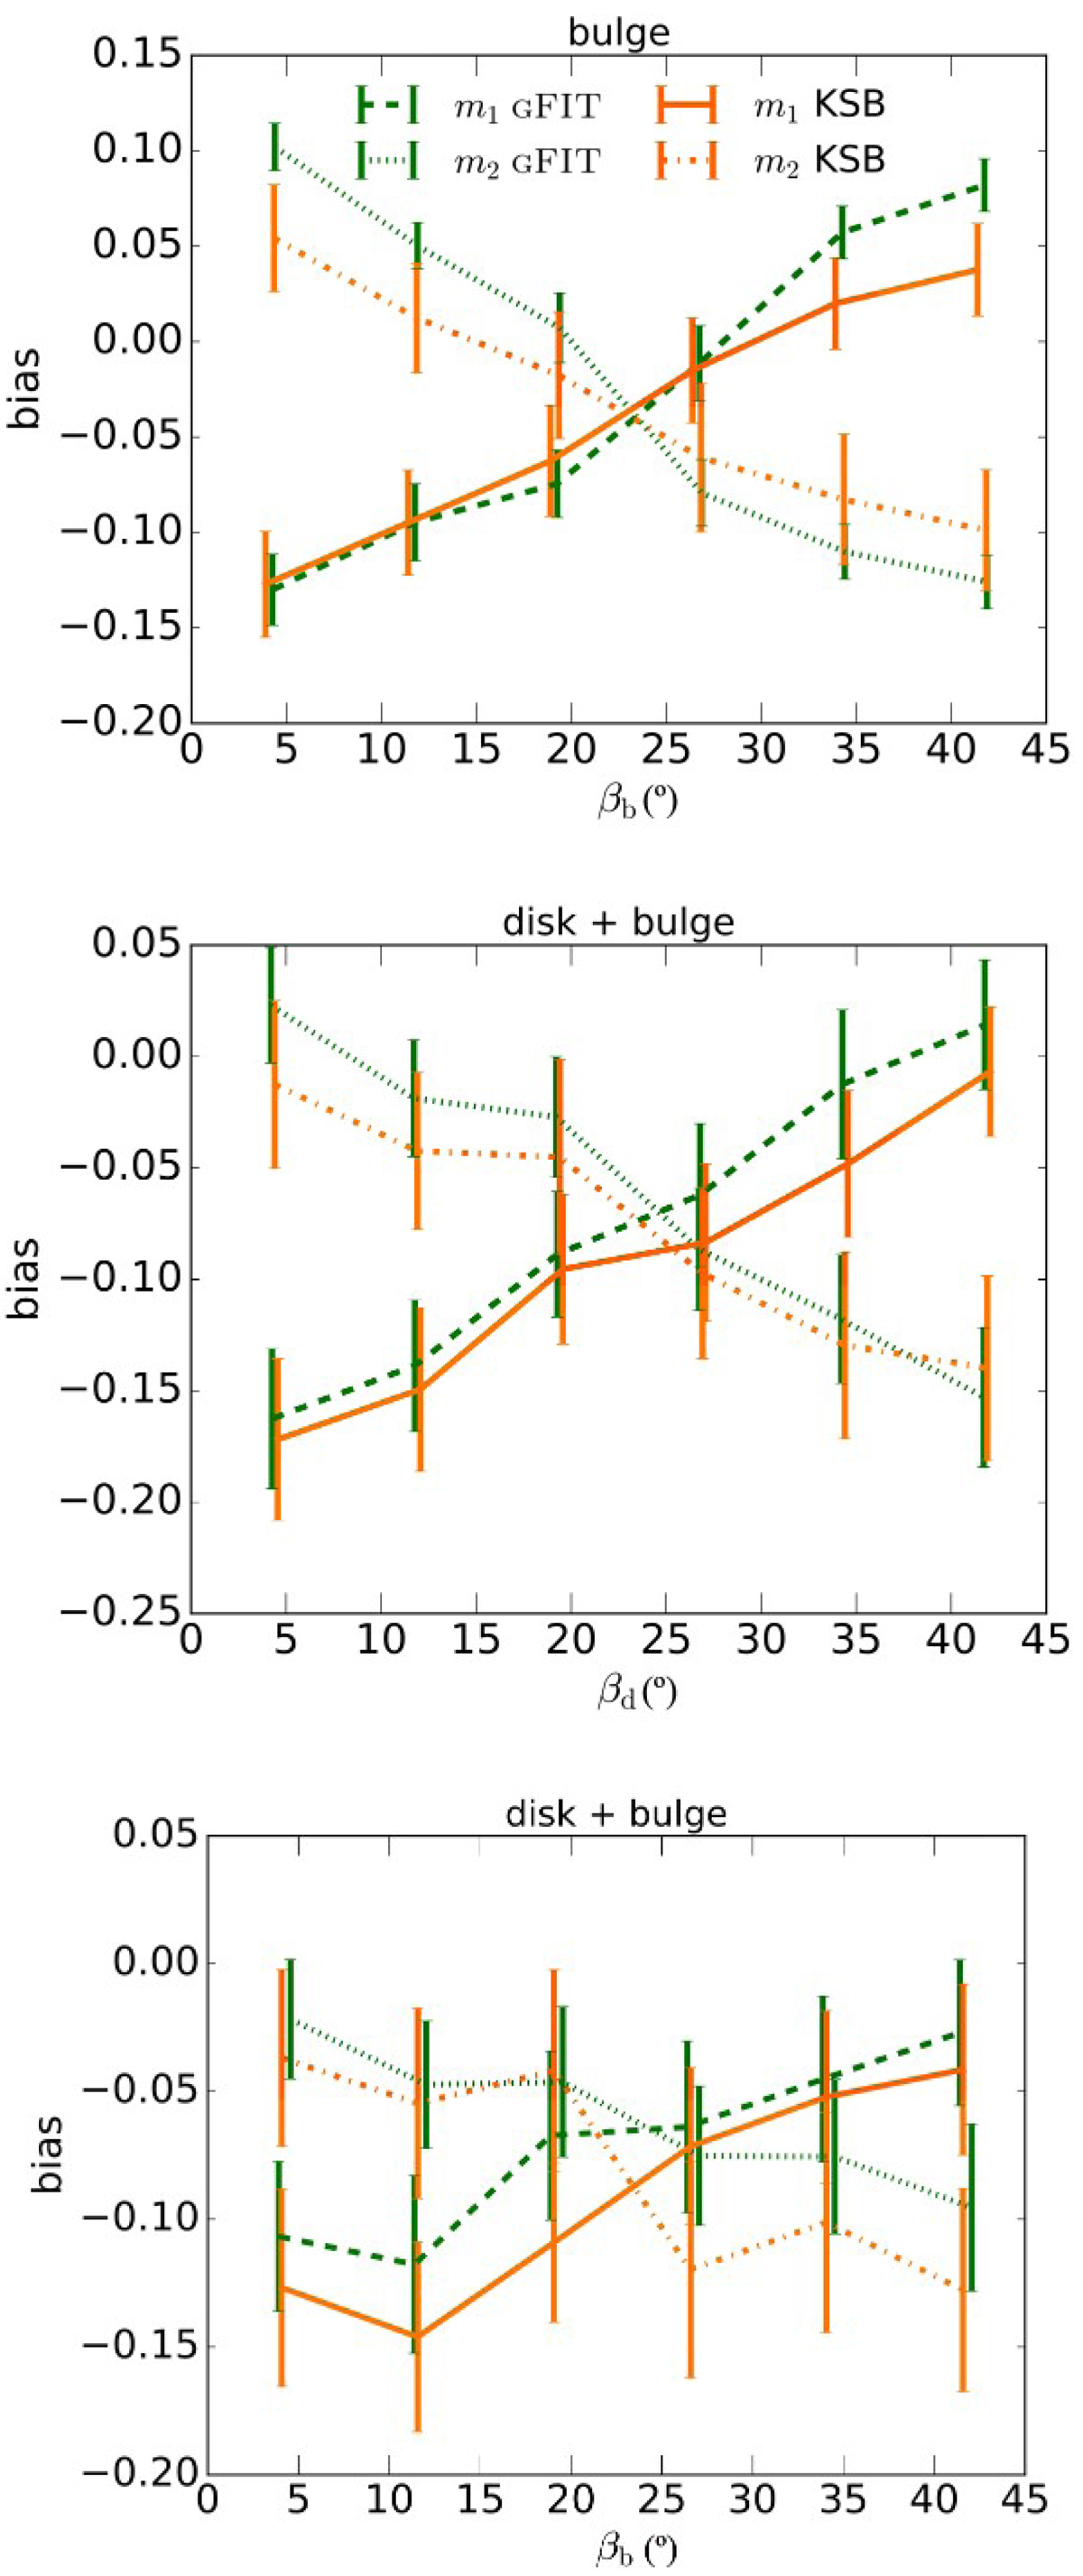
Multiplicative shear bias as a function of the input orientation angle for galaxies with only a bulge (top), and as a function of the disc (middle) and bulge (bottom) orientations for galaxies with a bulge and a disc. Green lines show the results of m1 (dashed) and m2 (dotted) for GFIT, and orange lines show m1 (solid) and m2 (dash-dotted) for KSB.
Current usage metrics show cumulative count of Article Views (full-text article views including HTML views, PDF and ePub downloads, according to the available data) and Abstracts Views on Vision4Press platform.
Data correspond to usage on the plateform after 2015. The current usage metrics is available 48-96 hours after online publication and is updated daily on week days.
Initial download of the metrics may take a while.