Fig. 11.
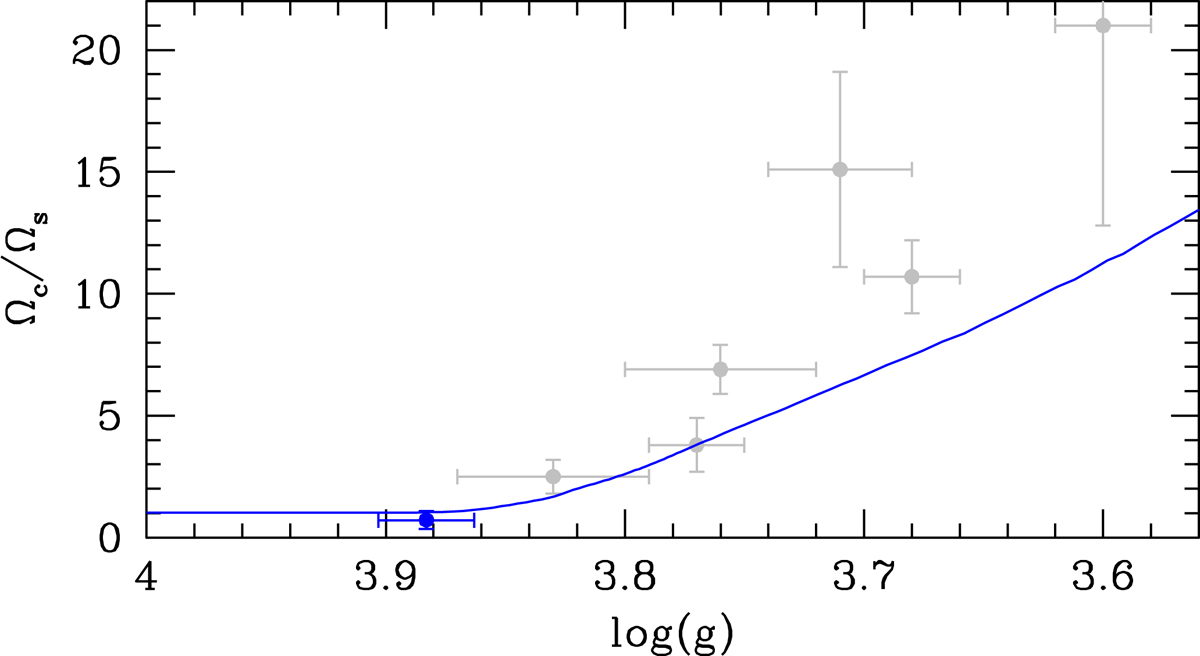
Ratio between core and envelope rotation rates obtained with GENEC and the formalism of Fuller et al. (2019) with α = 0.6 (blue line). The filled blue circle corresponds to the observed core-envelope contrasts for KIC 5955122. For visual comparison, the stars of D14 have been added to this plot (gray symbols). However, we note that evaluating the transport efficiency for these stars requires a dedicated modeling taking into account their masses and chemical compositions (see Fig. 3 of Eggenberger et al. 2019a).
Current usage metrics show cumulative count of Article Views (full-text article views including HTML views, PDF and ePub downloads, according to the available data) and Abstracts Views on Vision4Press platform.
Data correspond to usage on the plateform after 2015. The current usage metrics is available 48-96 hours after online publication and is updated daily on week days.
Initial download of the metrics may take a while.