Fig. 3.
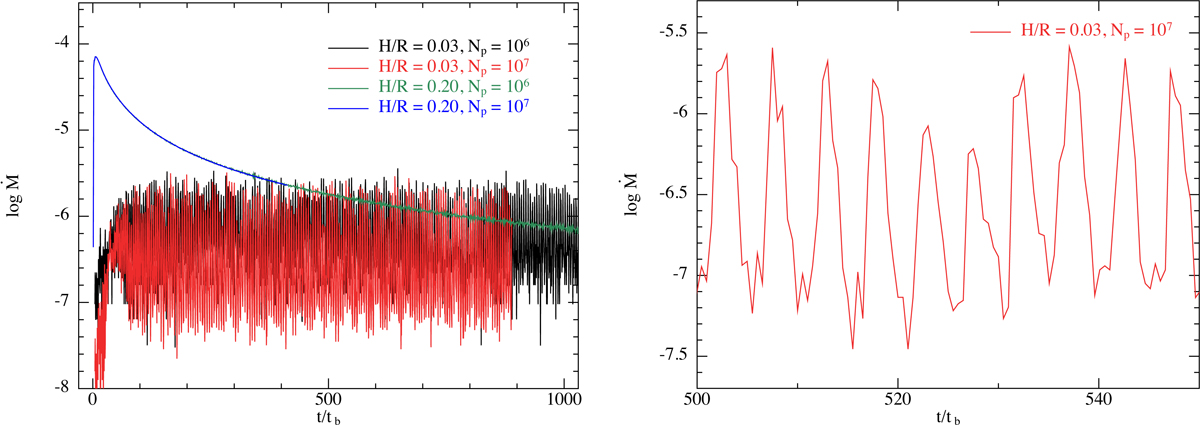
Time evolution of the accretion rate on to one of the components of the binary (recall that the binary is equal mass and near-circular and therefore the accretion rate on to each binary component is very similar). Left hand panel: compares the accretion rates for the thick and thin disc cases and at two different resolutions. The black line corresponds to the simulation with H/R = 0.03, Np = 106, the red line corresponds to the simulation with H/R = 0.03, Np = 107, the green line corresponds to the simulation with H/R = 0.2, Np = 106, and the blue line corresponds to the simulation with H/R = 0.2, Np = 107. For the thick disc case (blue and green lines) the accretion rate declines with time monotonically following the usual viscous decay of the disc surface density (cf. the right hand panels of Fig. 1). We note that the blue line (Np = 107) lies directly on top of the green line (Np = 106) demonstrating that the accretion rate is converged in this case. For the thin disc case the accretion rates show the same morphology between the two resolutions, but with a significantly different shape from the thick disc case. The binary accretion rate for the thin disc is highly variable, varying by up to 2 orders of magnitude on a timescale of ≈5tb. Right hand panel: zoom in of the accretion rate on to the binary in the thin disc case for Np = 107 between 500 and 550 binary orbits. The periodic nature can be seen clearly along with a secular variation corresponding to precession of the disc inner edge (see also e.g. MacFadyen & Milosavljević 2008).
Current usage metrics show cumulative count of Article Views (full-text article views including HTML views, PDF and ePub downloads, according to the available data) and Abstracts Views on Vision4Press platform.
Data correspond to usage on the plateform after 2015. The current usage metrics is available 48-96 hours after online publication and is updated daily on week days.
Initial download of the metrics may take a while.